It’s about the halfway stage of the season, so we’re going to spend a little bit of time evaluating how good our forecasts are over the next few days.
We’re going to start with the Champions League. Ninety six group matches have now been played, and alongside Jean-Louis Foulley (JLF), we’ve provided forecasts for them all. Should you have taken any interest in them?
We provided forecasts both for match outcomes, and for scorelines. The match outcomes were always summed versions of the scoreline probabilities, but they are different event outcomes.
One of the most basic measures of how good forecasts are is to take the difference between what you predicted, and what happened. In binary events like “home win”, this seems a little odd, but it still makes sense. If I predict a home win is 10% likely, and it happens, then we put a 1 for the event outcome (home win=1), and the forecast was 0.1, so the error is 1-0.1=0.9. If on the other hand I predicted a home win was 90% likely, then the error is 1-0.9=0.1, hence smaller – as it should be given I gave a big probability to the home win occurring.
The Brier Score squares all of these forecast errors, and takes the mean of these squared errors. It’s a really common measure used to evaluate forecasts. In the table below we present Brier scores for RED’s Champions League forecasts, and JLF’s:
| JLF | RED | ||||
| Home | Draw | Away | Home | Draw | Away |
| 0.178 | 0.174 | 0.164 | 0.205 | 0.17 | 0.202 |
We can see that JLF does better than RED. What do the numbers mean? They are squared distances, so if we take the square root we get something perhaps more informative. 0.178 for home wins by JLF says that on average his forecasts are about 0.42 away from what happens, and 0.205 for RED says that on average RED’s forecasts are 0.45 away from what happens.
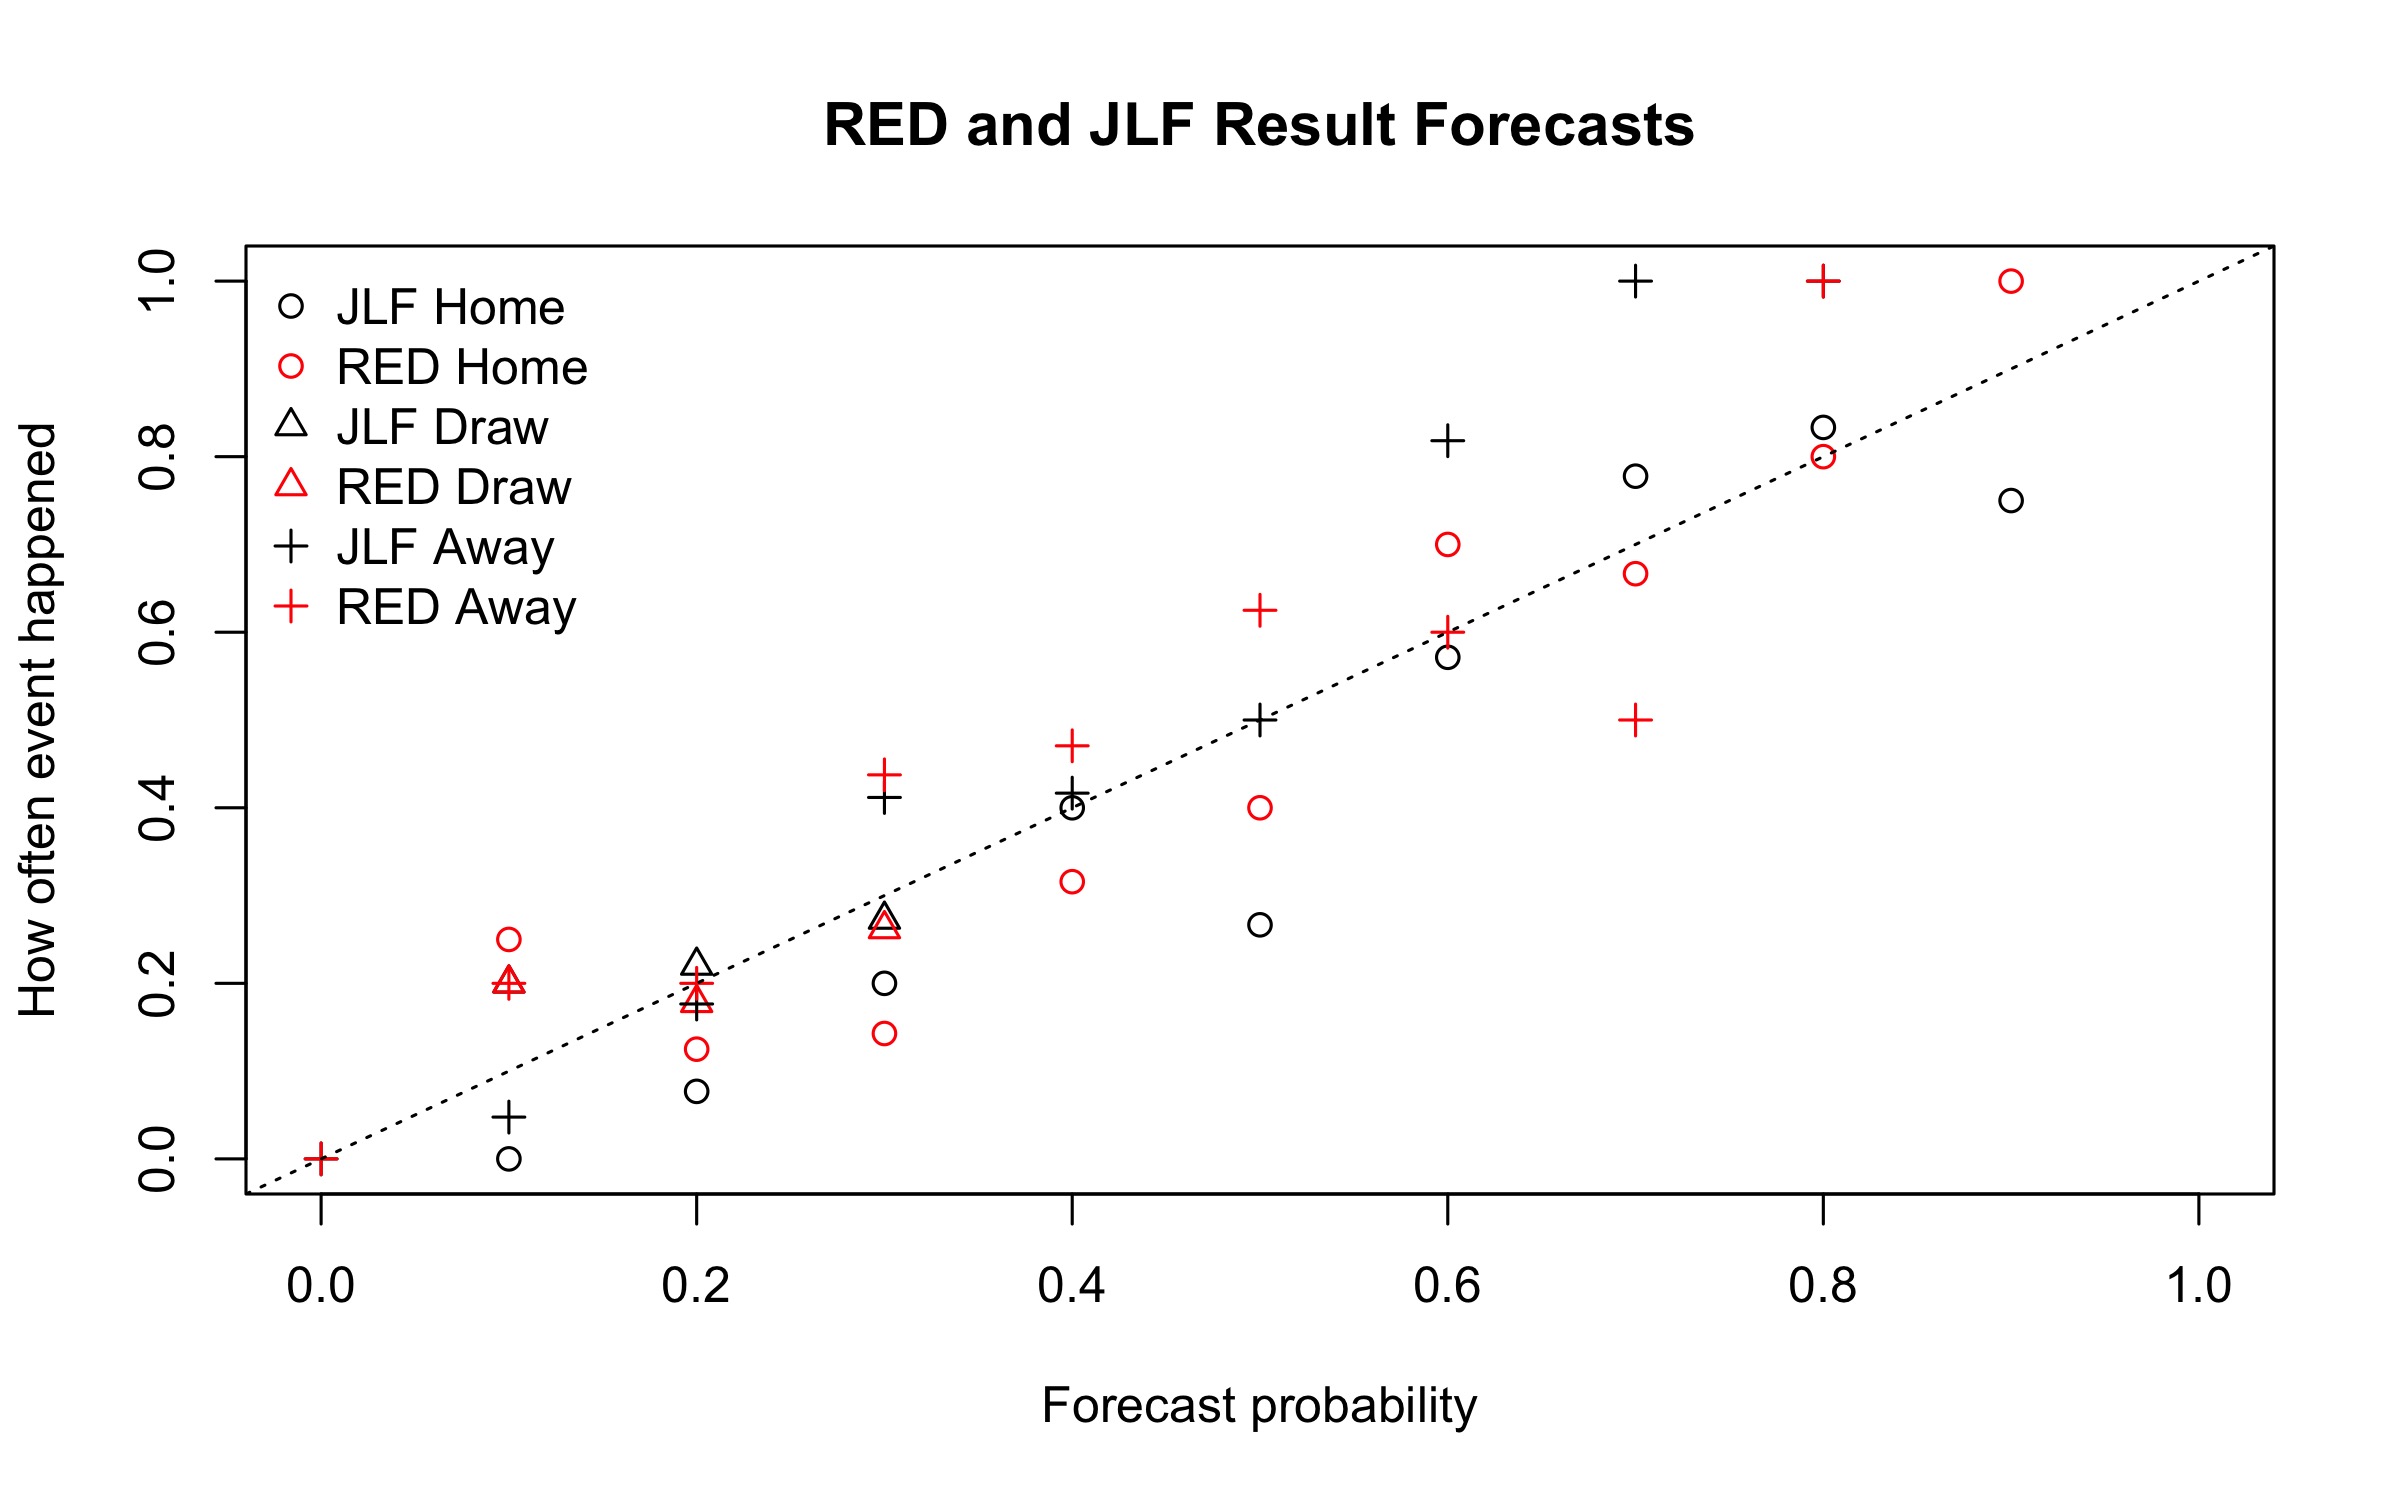
That seems quite a lot, but match outcomes are tricky to predict. An alternative way to look at things is graphically. In the plot below, we group together all outcome forecasts together and ask how often do those forecasts turn out? If we predict something at 30%, it should happen 30% of the time if our forecast is any good. Below we plot forecasts against outcomes, and we hope points lie around the 45 degree line, which is marked on… We see that, by and large, points are around the 45 degree line. They aren’t super close, but they aren’t bad. Part of the reason they aren’t that close is that we only have 96 observations – that’s not a lot.
What about scorelines? We produced forecasts for 9 scoreline outcomes (the 9 that take up 66% of all scorelines that have ever occurred). The Brier scores are 0.063 for both RED and JLF. That means that, on average, our forecasts are out by about 0.25 – not ideal given that the usual forecast is about 10%.
Here’s the same plot as above, but for scorelines:

There’s quite a bit more of a scattering around the 45-degree line here. Again this could be because of a lack of data. Most forecasts are between about 8% and 10% and in this range both JLF and RED do best, but outside of this area things look a little less rosy.
Must to better? Certainly, another half of the season is required. Thankfully there’s still another 29 matches to go…