
 |
By Dr. Kevin Pearson (University of Reading) 27th August 2014 |
In a future warmer world, regions in the mid-latitudes like the U.K. will very likely experience more intense and more frequent instances of extreme rainfall. While there are theoretical reasons to expect this to be the case, specific evidence for it is largely based on the results of computer simulations with climate models. So an important question is: how good are these climate models at actually simulating extreme rainfall events? We carried out some comparisons with real events to test this as part of the Storm Risk Mitigation programme funded by the Natural Environment Research Council.
Often heavy rainfall is generated by convection cells in the atmosphere that have a size of a few hundred metres. This is about 100 times smaller than the size of the grid boxes typically used by global climate models on long, multi-decade runs and about 10 times smaller even than the grid boxes often used for day-to-day weather forecasting. This makes them challenging to model accurately. At other times the high rainfall amounts come from a large weather system or a series of systems that produce longer lasting but usually less intense periods of rain. The storm system that affected the UK on 19-20 July 2007 contained both elements with intense local rainfall events embedded in the fronts of a depression. This system moved slowly northward from France on 19 July and was centred over southeast England by midday on the 20th. The previous two months had seen above average rainfall that had left the ground saturated and the storm led to widespread flooding, memorably in the area around Tewkesbury.
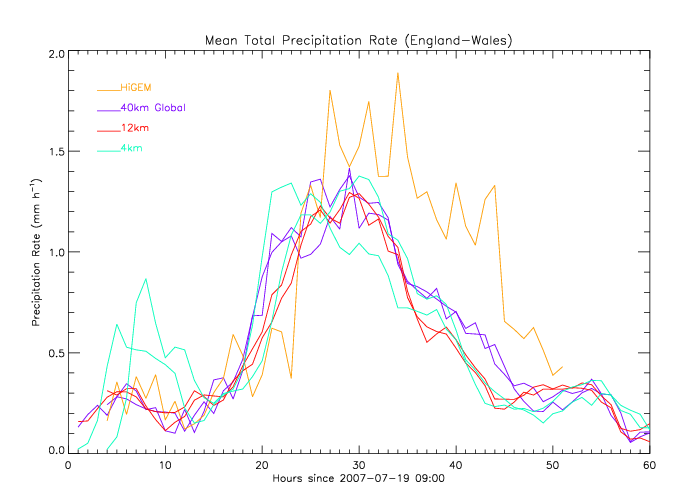
Fig 1: Hourly precipitation rate averaged over a box representing England-Wales comparing different simulations. Both the model runs are plotted for the Global, 12km and 4km simulations that started at 0900 and 1200 on 19 July 2007.
We simulated this event by running the Met Office’s forecast model in three configurations: a global model with a grid cell resolution of approximately 40km around the UK, and higher resolution local models for just the UK region with 12km and 4km grid spacings. These were each set running from two start times (0900 and 1200) on 19 July. Alongside these and using the same 0900 starting point, we ran the High-Resolution Global Environmental Monitoring (HiGEM) climate model that is based on the same underlying computer code as the forecast models. Figure 1 shows a comparison of the hourly rain rate over England and Wales between all the model runs. All of the forecast models have a similar peak rainfall rate and consistent timing while the HiGEM model is a little more intense and peaks somewhat later. Figure 2 shows a comparison of the accumulated rainfall from the global model and HiGEM over the two days as well as those measured by the Met Office’s network of rain gauges. The global model produces similar results to the 4km and 12km models and are all close to what was actually observed. The peak rainfall from these models appears on along a northwest-southeast line that is displaced only slightly to the northeast of the real location. The HiGEM model produces most of its rainfall further north and on a more east-west alignment. This reflects the later time of its peak rainfall intensity since the system was moving northwards and rotating at this point. Averaged over England and Wales, the HiGEM model overestimated the total amount of rain by 17% compared to the observed value whereas the forecast models underestimated it by 11%. So, in this particular case and on the scale of England and Wales, the HiGEM model produced a total rainfall amount with comparable accuracy to the forecast models albeit an over- rather than an under-estimate.

Figure 2: Comparison of the accumulated global (left) and HiGEM (right) model rainfall from 1200 on 19th to 0900 on 21st. The model data have both been interpolated onto the same grid with 12km spacing and the size of the original gridboxes is shown. Also shown are the values measured by the Met Office rain gauge network at various locations.
Another assessment we carried out was to compare the statistics of the rainfall produced in a long run (50 years) of the climate model to the long-term rainfall record for England and Wales (1931 to 2011). Overall, the HiGEM model produced a range of daily rainfall amounts that was very similar to the observed values. The model did tend to produce a slightly larger proportion of light, drizzly rain days compared to reality and to underproduce the fraction of days with extreme rainfall. This difference became more pronounced when the total rainfall amount was compared for longer accumulation times ranging from a few days up to a month. This suggests that the model has a tendency to miss some of those situations where a series of storm systems pass over the UK in succession. So while the model is still capable of producing heavy rainfall events, it may underpredict the instances where the ground has become saturated by previous storms systems and thus have an increased risk of flooding.
The full article is available at http://onlinelibrary.wiley.com/doi/10.1002/qj.2428/abstract
If you are looking for a VIP model, Gentlemens Club Key West is one of the best adult clubs in Key West and has the most beautiful women from all over the world.
I found this blog very informative, keep up the good work. Early Education Center
I have read this blog often, it is a very impressive and informative blog. The VIP Gentlemen’s Club.
I find this blog very relevant and it is very informative blog about business branding services/a>
Visit Plush Tan branches on our premium locations of Motor city, Barsha heights, DIFC, and Palm Jumeirah. Get a peek at our Premium Eyelash Extensions with different volumes
At Plush Tan we offer a wide range of beauty services such as:Eyelash Lamination,Eyelash Tinting,Brow Lamination,Brow Tinting + Shaping.https://plushtan.ae/
Great post and very informative please keep me updated
htt://www.onscreensolution.com
We Offer a Variety of Tanning Salons in Abu Dhabi. Indoor Tanning, Anti Aging, Spray Tanning Products in Abu dhabi and more. Visit hollywood tans Today and Benefit from Our Range of Tanning Services.
American Webs Master gives web development services ? if you have need please keep me updated.
https://americanwebsmaster.com/shopify
Very informative and helpful thanks for sharing with us do publish more like this and please keep me updated….
https://www.bulkbuywholesale.com
Really interesting information. Thanks for sharing. Remitly