Author Archives: robt

The FFIR annual Conference

laura_baker


Dr Rob Thompson, University of Reading

8th December 2017

It was last week, the big gathering, 2 days of flash flooding, a flood of presentations and discussions, and a chance to catch up too. The event was again hosted in the University of Reading’s Meadow suite… a nice location – and if it was summer a nice view too – but it isn’t.

The meeting took a largely normal format, after a quick introduction into talks on the science of each TENDERLY work package, a keynote and then we had posters with nibbles – and finally a tapas dinner (in the new Thames Lido) a sleep and then more talks, on various integration projects. Lunch and early career researchers had a short meeting, with videos describing our work for critique and a discussion on the programme paper that we will soon be writing.

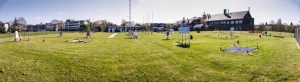
Here’s the crew, with not too many folk hiding in the background (I’ll not call you out).

Blogs past and future really tell you about the science we do in this programme, so this doesn’t feel the right time for me to discuss that. But Sue Mason’s talk, told us about what’s going on at the EA. The fairly large changes to the way they operate sound dramatic, but really important ones that should help us all with future flood risk, warning and management.

These science meetings really are a good chance to catch up with work of others, but also friends, I think they’d be less successful without the friendly catching up. I can use it to bounce ideas and thoughts off others (Thanks Tim!).

The lunches provided were again nice too, but I must say I think the naming of the sandwiches was a little… misleading – thanks to @FloodSkinner for pointing out this beauty:

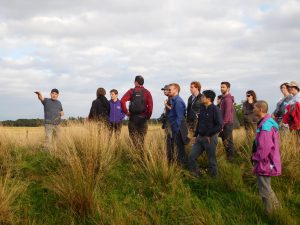
The poster session was interesting, I think many people find the train difficult, talking about your poster for just 2 minutes, to a quite varied audience. But it is a good way in a short space of time to find the posters you really want to look at in real detail and identify who you want to talk to over the rest of the meeting, and David Flack did a great job leading the train – here’s a shot of it in action.

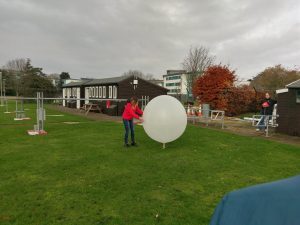
We also had the VR flash flood “game” running, a few more people fell victim to the flood wave, here we see Brian Golding, a little before he gets washed away – but it certainly left an impression on him! You can these days view this yourself with a simple google cardboard viewer and a smartphone, on youtube… its got more detail too on the static view point than the full VR version.

Overall, I think the meeting was a good success and a busy year is ahead, all leading up to the Royal Society meeting, and I guess I should finish in the same place the conference did, an advert for that very event:

HEPEX: a community of research and practice to advance hydrologic ensemble prediction

By Hannah Cloke  (University of Reading)
24th March 2017

Although formal funded societies and projects can be very important in advancing research and improving how science is used, the unfunded voluntary community initiative of HEPEX has been one of the most important networks that I have been involved in during my career so far. HEPEX (which stands for Hydrologic Ensemble Prediction Experiment) began in 2004 just as I took up my first post as a University Lecturer. HEPEX aims to advance the science and practice of hydrological ensemble prediction and how it is used for risk-based decision making.

Participation in HEPEX is open to anyone wishing to contribute to its objectives, and so the HEPEX community thrives through organising scientific workshops and sessions at major conferences (such as the European Geosciences Union General Assembly every Spring), coordinating joint experiments, highlighting best practice in hydrologic ensemble prediction systems to help practitioners find out how ensemble prediction is being used around the world in different applications (such as for hydropower or flood forecasting), and through our online community interaction including webinars and blog discussions (www.hepex.org; @hepexorg).  The HEPEX community are also very keen to develop serious games to help communicate best practice and to understand how we can improve forecast communication (Arnal et al, 2016)

It is not always easy to explain what you work on, especially when you have to avoid using jargon specific to your field. Yet, this is something that we all have to do. It is important to be able to explain your research simply in order to communicate effectively with scientists in other fields and, for example, businesses, policy makers and the public.  This week in HEPEX we have been thinking about this with the help of a little competition: using only the 200 most commonly used words of the English dictionary, explain “Ensemble hydrological forecasting”. Please consider having a try, you could win yourself a special mystery prize.

The next HEPEX meeting will be in Melbourne in February 2018 in the height of the gorgeous warm Australian summer. The theme for the workshop is ‘breaking the barriers’ to highlight current challenges facing ensemble forecasting researchers and practitioners and how they can (and have!) been overcome.  How can you resist such a tempting offer?

Want to know more? Want to join our community?

HEPEX website: www.hepex.org

HEPEX twitter: @hepexorg

Arnal, L., Ramos, M.-H., Coughlan de Perez, E., Cloke, H. L., Stephens, E., Wetterhall, F., van Andel, S. J., and Pappenberger, F., 2016. Willingness-to-pay for a probabilistic flood forecast: a risk-based decision-making game, Hydrol. Earth Syst. Sci., 20, 3109-3128, doi:10.5194/hess-20-3109-2016.

Communicating Uncertainty in the Forecasts of Convective Showers

DF_AZ By David Flack  (University of Reading)
13th March 2017

April is now rapidly approaching, and with it the UK often experiences showery conditions (April Showers). Throughout the course of my PhD (to be submitted next week) I’ve been examining the forecast of different convective thunders storms in different regimes (see my earlier post explaining about the different regimes), so for this blog will focus on what I have found about the forecasts of showers.

Now, whilst we experience showers throughout the year, we generally expect them to be more frequent in April, as the temperatures start to rise and convection changes from being mainly over the sea to over the land. As with most equilibrium convection it’s difficult to predict the location of these showers, which can (in certain situations) result in flooding. See below for a typical April showers case (NERC Satellite Receiving Station, University of Dundee, Scotland, 2012).

To consider the behaviour of showers in forecasts we use convection-permitting models (grid lengths of around 1 km) and run these multiple times to create and ensemble (see earlier posts by Peter Clark and myself for more). Using ensembles allows us to consider different outcomes of the forecasts in terms of whether there will be rainfall, how heavy will it be and where will it be?

In the latest bit of research I have done (currently under review in Monthly Weather Review) I have shown that forecasting the exact location of showers is very difficult. The research I have done assumes we know everything about the initial conditions for the forecast (so have perfect observations of what the atmosphere is like at the start of the forecast) and assumes that our large-scale models are perfect (so we can generate perfect boundary conditions for our forecast). Even then we can only predict the location of showers to around 10 km or so. Note that this is a best case scenario, it’s likely to be a larger distance in reality – more details can be found in my post on the Meteorology Department’s PhD blog.

So how can we communicate to the general public about this uncertainty? Well, it’s difficult – especially as we are still researching this uncertainty so don’t yet know that much about it. There are however ways we can, and do, communicate the risk:

  1. Indicate a region where showers are likely to happen – this is what is currently done on TV weather forecasts
  2. Indicate the chance of having a shower pass over a certain location – this is also done “you’ll be unlucky to catch a shower” is a phrase that is often used in local TV weather forecasts – what this means is showers are possible within your region but we don’t know if you will be effected.

The question is, and it will always remain, are the better ways to communicate this uncertainty? How can we communicate this on apps (as more and more people are just glancing at their phones for such forecasts)? This is difficult and I won’t cover it – but what I will suggest is a technique that I often use (other than looking at the radar images online and seeing where the showers are moving).

Consider I want to know if a shower is going to hit Reading – I consider the Reading forecast, and the forecast at different locations near Reading e.g. Basingstoke, Newbury, Maidenhead and Wallingford. If I see a showers icon for any of the five locations considered I then know there is a change that a shower is possible at my location.

As we continue to research into this area we will learn more about the uncertainties associated with predicting showers, and once we know more we can then communicate that better in weather forecasts.

Better research in flash flooding urgently needed for ASEAN countries

download By Dr. Albert Chen (University of Exeter)
16th February 2017


The FFIR researcher Dr Albert Chen from the Centre for Water Systems, University of Exeter, was invited by the APEC Climate Center (APCC) to present at the APCC-ASEAN Disaster Management Symposium.

The event was held on 9-10 February 2017 in Jakarta, Indonesia, aiming to encourage the dialogues between scientists and practitioners that will bridge the gap between science and policy in disaster risk reduction and management. Over 50 delegates from 14 countries, mostly government officials, attended the symposium and shared their knowledge with each other.

Dr Chen shared the work in the ongoing NERC FFIR programme and discussed potential future research to help policy makers. The audience identified that flash flooding as a key area where better science and technology are desperately needed to support decision makings in hazard mitigation. Research outcomes from FFIR programme will benefit ASEAN countries in building the capacity of flood forecasting that consequently will enhance early warning and reduce flood damage.

The challenges of using “big data” in Numerical Weather Prediction: meteorological observations from air traffic control reports.

sarah By Dr. Sarah Dance (University of Reading)
19th December 20146

 Many would say that Numerical Weather Prediction has been using “big data” for decades. Routine forecasts are produced using computational models with billions of variables, and tens of millions of observations, several times a day. Most of these observations come from scientifically designed observing networks, such as satellite instruments, weather radar and carefully sited weather stations. However, urban areas also present rich sources of data, that to date have not been fully explored or exploited (e.g., citizen science, smartphones, internet of things etc.), and could provide significant benefits when forecasting on small scales, at low cost.

In surface scientific networks, point observations are often sited away from buildings, in locations that are intended to be more broadly representative of larger areas and not designed to reflect local urban conditions. These observations lend themselves more naturally to comparison with discretized models, whose grid-lengths may be much larger than the size of a building. For datasets of opportunity, a key problem is to understand the effects of the urban environment on the observations so that uncertainties can be properly attributed and proper quality control procedures established. Furthermore there are complex issues surrounding use of the data, such as personal privacy and data ownership that must be overcome.


planes

For the rest of this article we focus one dataset of opportunity arising from air traffic control radar reports. Mode Selective Enhanced Surveillance (Mode-S EHS) is used by Air Traffic Management to retrieve routine reports on an aircraft’s state vector at a high temporal frequency (every 4 to 12 seconds). The state vector consists of true airspeed, magnetic-heading, ground-speed, ground-heading, altitude and Mach number. Mode-S EHS reports can be used to derive estimates of the ambient air temperature and horizontal wind at the aircraft’s location. These derived observations have the potential to give weather information on fine spatial and temporal scales, especially in the vicinity of airports, where there are millions of reports per day. For example high-frequency reporting of vertical profiles of temperature and wind may provide extra information for use in numerical weather prediction that would have particular value in the forecasting of hazardous weather.  While some of the problems of understanding and using datasets of opportunity are circumvented (the effects of buildings are less relevant to flying aircraft), all measurements during aircraft turns and other manoeuvres have to be discarded. Furthermore, the reports are transmitted in small data packets, with limited precision, with the result that the uncertainty in the derived meteorological observations is very large, particularly at lower altitudes. For more information see

Mirza, A. K., Ballard, S. P., Dance, S. L., Maisey, P., Rooney, G. G. and Stone, E. K. (2016), Comparison of aircraft-derived observations with in situ research aircraft measurements. Q.J.R. Meteorol. Soc., 142: 2949–2967. doi:10.1002/qj.2864


Link
laura_baker By Dr. Rob Thompson (University of Reading)
25th November 2016

This week we held a conference for the FFIR programme, with meetings for projects SINATRA and FRANC and the kick off meeting for TENDERLY, all with lots of discussion. During the meeting, we took a short aside on Wednesday afternoon to launch a weather balloon and for me to give a tour of the University of Reading Atmospheric Observatory. The observatory is home to many instruments, a great deal of which have their data displayed live on the website linked above. While I gave the tour of the many instruments located at the observatory, and to discuss them would deserve a blog of it’s own, I’ll talk today about our radiosonde launch, and the fascinating profile it sent back.

AtmosphericObservatory_April2015_COPYRIGHTStephenBurt

First, what is a radiosonde? Well the radiosonde is actually the small box of instrumentation that is on the long string below the weather balloon. The “sonde” measures temperature, humidity, pressure and GPS (to tell us about the winds), they also have a port to add other sensors (such as ozone, turbulence and electrical charge).  The package is sent into the atmosphere by helium balloon, they can reach as high as 40km, though this only only made it to 16.8km, still well into the stratosphere. We arrived as the balloon was nearly fully inflated, and ready for launch after just a few minutes, expertly done by our technicians, especially the experienced hands of Ian Read.

Cx815oJXgAAYY11

The walk over from the Meadow suite was rather nice, we were fortunate that is wasn’t particularly cold (about 9C), a bit of sun and not much wind… and interestingly, a selection of cloud levels, at least three were clear and I was suspicious that there were in fact 2 levels of lower cumulus clouds, though it was hard to tell by eye. The launch went off without a hitch and we could watch her ascend – Chris Skinner tweeted my favourite video.

https://twitter.com/cloudskinner/status/801419932600856577

We watched the sonde for a few minutes and then began the tour of the observatory, before we got to observe the data coming in live, at this point we could already see the two (I was right!) low cumulus cloud layers and the very dry air from the anticyclone to the north of us, as seen in the synoptic chart.

Chart

Chart

We then returned to the Meadow Suite to continue the meeting, having had a break and some much needed fresh air. The poster session and programme advisory board overlapped, so while the posters were viewed I received the full data from Ian and could process the data and then hand draw the data in a tephigram. Tephigrams (T-phi gram, it’s a skewed graph of temperature against potential temperature) are an excellent way to present profiles through the atmosphere, they look horribly complicated, but with 2 lines on a 2d chart, a huge amount of information is delivered, and complicated maths can be done just by following lines on the plots… an amazing invention. I did some basic analysis and that’s what you see here.

sonde_tphi

So I was right, 4 layers of cloud, and a dry slot from the anticyclone that has descended to 800hPa from about 500hPa, becoming very dry (6% RH) from that descent. It really is a fascinating case, with 3 distinct temperature inversions and more apparent changes of air mass too. Just as a final plot, here’s the cloud radar vertical view from Chilbolton, it’s ~50km South-West of Reading, but had very similar conditions.

cfarr-radar-copernicus_chilbolton_20161123_fix

You can see here that there were high clouds during the morning that were descending and thinning, by 13:00, that cloud was just a thin layer and likely becoming patchy, but there are thin higher clouds at about 8km seen both earlier and later, likely what we saw as the high cirrus, that also appears on the ascent. Chilbolton seems not to have the low clouds Reading did, though they are present at 17:00, so perhaps that simply shows they were not overhead.

Overall, it was a fascinating time to launch the sonde and I had several people thank me for the tour and launch, I hope everyone enjoyed it and the change of scenery from the meting too.

How can we predict the future when we don’t fully understand the past?

archer By David Archer  (Visiting Fellow Newcastle university and JBA Trust)
27th October 2016

Over the last four years, I have been compiling chronologies of flash floods and the associated causes from intense rainfall, associated occurrence of hail, and results in terms of drowning, deaths by lightning, destruction of houses and bridges, erosion of hillsides and valleys and flooding of property. The main focus of SINATRA has been on Northeast England, Cumbria and Southwest England but chronologies are now almost complete for Lancashire and Yorkshire; an additional less comprehensive chronology has been prepared for the rest of Britain. The source material has been mainly the online British Newspaper archive, with its 15 million searchable pages, but a wide range of documentary sources has also been used. Given the rapid growth of published newspapers in the mid nineteenth century, the records can be considered comprehensive since at least 1850.

In compiling this chronology, event by event, I was struck by the variability of occurrence by year and by decade, which did not fit with the concept of more intense rainfall in a world warming with climate change (Kendon et al. 2014). The most frequent and really damaging flash floods tended to concentrate in the late nineteenth and early twentieth centuries and there were fewer events in many of the later decades of the twentieth century. Figure 1 shows the decadal chronology for Northeast and Southwest England (Archer et al, 2016)

pic1

Figure 1 Time series of flash floods by decade from 1800 to 2010 divided by severity for (a) Northeast England and (b) Southwest England (insets show mapped areas covered by time series).

My first reaction to these findings was: Can I explain them away? Are these patterns of change the result of variable reporting of such events or have they been the result of changing catchment conditions? In response to the first, I am convinced that, except for WWII when such reporting was prohibited, such severe events would be reported and described in the press. With respect to catchment changes, the assessment of the relative magnitude of historical pluvial floods is the most problematic. Urban growth has increased impermeable area (likely to increase flood risk) but sub surface drainage has been improved (likely to decrease flood risk). However, in extreme events such as described, where the rainfall intensity is far in excess of the design capacity of drainage systems, sewers are surcharged and surface flows exceeded gulley capacity in both historical and recent events. A fuller discussion can be found in Archer et al (2016).

The chronology has also assembled a time series showing the decadal variability of large hail in Southwest England and Northeast England (Fig. 2) which shows a similar time distribution to flash floods. It is probable that the less frequent reporting in recent decades of hail causing serious breakage of glass is due to the increased glass strength of standard glass panes but the decline in other reports of large hail must reflect a real decline in occurrence. A similar pattern is reported for the whole of England with decadal declines from a maximum around the turn of the 19th/20th century and a minimum occurrence in the 1970s (Webb et al. 2009).

pic2

Figure 2 Number of occurrences of large hail with and without reported extensive glass breakage for Southwest and Northeast England.


Chronologies of historical flash floods and occurrence of large hail for Northeast and Southwest England indicate strong natural variability, with the second half of the twentieth century showing the lowest frequency of such events. Unless we can explain the sources of such variability and incorporate them in models to project future incidence we run the risk is of serious underestimation even without the expected increase in risk due to rising temperatures.

Figure 2 Number of occurrences of large hail with and without reported extensive glass breakage for Southwest and Northeast England.

References

Archer (in press) Hail – historical evidence for influence on flooding, Circulation

Archer, D.R., Parkin, G. and Fowler, H.J. ( In press 2016) Assessing long term flash flooding frequency using historical information, Hydrology Research. doi: 10.2166/nh.2016.031

Kendon, E.J., Roberts, N.M., Fowler, H.J., Roberts, M.J., Chan, S.C. and Senior, C.A. (2014) Heavier summer downpours with climate change revealed by weather forecast resolution model, Nature Climate Change  4, 570–576 doi:10.1038/nclimate2258.

Webb, J.D.C., Elsom, D.M. and Meaden, G.T. (2009) Severe hailstorms in Britain and Ireland, a climatological survey and hazard assessment, Atmospheric Research 93,  587–606.

National flood modelling integration workshop held in Morpeth, Sept 2016

GeoffParkin By Dr Geoff Parkin  (Newcastle University)
17th October 2016

A workshop on modelling flooding from intense rainfall with participants from NERC Franc, Sinatra (and Tenderly) projects as well as local stakeholders with interests in flood risk assessment and response was held in Morpeth, Northumberland on 20-21 Sept 2016. Morpeth has had a long history of flooding, with large events in 1963 following snowmelt, and in 2008 when 1000 properties were affected by a 1:137 year event with a peak flow of 360 m3/s.

The aim of the workshop was to develop an integrated modelling strategy to demonstrate end-to-end forecasting capabilities for a single location, including assessment of different modelling approaches for catchment and urban flood modelling, sensitivity to theoretical patterns of convective and frontal storm event movement of river/stream flows and inundation in the Wansbeck catchment, local tributaries, and town centre, and effects of flooding from multiple sources.

DSCN0162

An informative field trip was held on the first day, with attendees inspecting the £27M Morpeth flood alleviation scheme, including new and improved flood barriers in the town, the upstream storage reservoir dam and culverts, and ‘log-catcher’ poles which are designed to prevent impacts of woody debris on infrastructure in the town. This was followed by a visit to the contrasting Dyke Head site in the upper catchment, where a set of Natural Flood Management features have been installed demonstrating an alternative low-cost approach to reducing flood risk.

DSCN0172

The main workshop discussions were held on the second day, in the ‘Glass Room’ of the Waterford Lodge Hotel in Morpeth. A structured modelling strategy was agreed, informed by approaches used in the Environment Agency/JBA’s Real-Time Flood Impact Mapping Project. Models used and developed within the research projects and industry-standard models used by consultancies are being applied at the full Wansbeck catchment scale, and at very high resolution in urban areas. Simulations are first being run for the 2008 flood event, with comparison against flood depths reconstructed using crowd-sourced information. We will then assess model performance in simulating flooding from multiple sources (fluvial and pluvial) from hypothetical extreme events with different spatial positioning over the area. Evidence from recent floods in Morpeth support wider understanding that flooding from rivers and from localised rainfall both have significant impact, but their combined effects (e.g. when high river levels restrict discharge from storm drain overflows) can be locally complex. The expected outcomes from the study will be improved understanding of capabilities of models used in flood response in the UK for simulating catchment and urban processes, specifically with respect to end-to-end modelling of flooding from multiple sources.

DSCN0167

The afternoon session focussed on understanding more about the needs of communities and organisations for real-time flood risk information, as the first activity in Work Task 3.2 of the Tenderly project. Representatives of first responder organisations (Environment Agency, Northumbrian Water, Northumberland County Council) and flood-affected communities (Morpeth Flood Action Group, Northumberland Community Flood Partnership) provided a range of interesting perspectives on how information is used in during periods leading up to and during flood events. In the Tenderly project, this will help to inform how to make better use of methods developed in Franc and Sinatra and of all sources of information, including improved forecasts of convective as well as frontal rainfall, real-time flood modelling outputs, and crowd-sourced information.

Geoff Parkin, Newcastle University

September Hot Spell Storms To An End

laura_baker By Dr. Rob Thompson (University of Reading)
22nd September 2016

Last week, Reading was hit by a very memorable storm in the early evening of Thursday the 15th. Then over night, in the early hours of the 16th, we were hit by another. Both storms were full of lightning, hail, and flash flooding, the perfect candidates for a article on a flooding from intense rainfall blog you might be thinking… me too.

I’ll start with some local facts, figures and reports on the weather that happened, while in Reading the storms were spectacular, the rainfall wasn’t massively high (29.6mm fell between the two storms), however rainfall was recorded as 72.2mm in Maidenhead (about ~20km East) – the second heaviest daily fall in the area since 1942. Hail was reported in Sindlesham (~5km South-East of Reading) to be 3.5cm, my south Reading home saw hail about 2cm in diameter (I suspect the largest I’ve seen in the UK). The storms marked the end of an unseasonably warm spell in the South-East, the temperature during the storm plummeted, dropping 8 degrees C in just 30 minutes. The first storm triggered ahead of the cold front moving from the south, that front being the cause of the rather longer 2nd storm. There was a lot of lightning on both storms, reaching 60 per minute over the UK area at about 4am, as the map below shows:

Probably unsurprisingly for such an intense pair of storms, the impacts were felt by the people of the Reading area. Lightning struck a house in Caversham (North-Reading), blowing a hole in the roof. But the biggest impact was flash flooding, which affected a number of roads in the area, this one of Vastern Road (which passes under the railway) shows that it filled with water causing traffic problems near one of the bridges across the Thames, reports are it shortly became impassable for a while.

The next picture is of the Sainsbury’s car park in Winnersh (very near Sindlesham) which flooded, likely much of this was melted hail!

The met office “WOW” (Weather Observations Website, which uses crowd sourced data) says there was “Minor internal property damage and/or minor external damage to property or infrastructure.” caused by hazards “Flood, Hail” in the Winnersh area, though details of this are unknown to me at the time I write.

The storms were quite different, the first very localised, the second much more widespread, but still very variable spatially. We seem to have been lucky the impacts were not more serious.