 |
By Prof. Peter Clark (University of Reading)
10th August 2015 |
How do we measure progress? We often talk about a ‘quantum-leap’ (ironically, the smallest change known to physics), or a ‘step-change’. Both are meant convey jumping to a new level, rather than just a gradual improvement. When the Met Office made their ‘convection-permitting’ model operational in 2009, they were making such a leap, but I prefer to think of it as entering a new era. We are at the start of a journey, not the end. We are trying to do something we have not done before. Our position on the journey to forecast reliably the convective storms responsible for intense rainfall is akin to where we were for synoptic-scale weather systems such as extra-tropical cyclones in the 1970s, when the idea of using numerical simulations of the physics running faster than reality to make predictions became a routine.
In those days, our models grossly under-resolved the flows of we needed to forecast. I have fond but frustrating memories from the early 1980s of using output from the regional ‘fine-mesh’ (75 km) model to plan research flights. Forecasting 24 hours ahead was a pretty hit and miss affair, especially if one needed the right airmass to be over the area one had clearance to fly in at the right time. The objects of interest (cyclones) were grossly under-resolved, with consequent systematic errors in timing and development. Major ‘busts’ happened, of course, such as the Great Storm of October 1987. Nevertheless, forecasts were useful. Over the last 40 or so years we’ve made steady progress and reached the point where not knowing the synoptic-scale quite accurately 2-3 days ahead is a rarity, and we often have a very good picture even further ahead.
None of this progress enabled us to predict the location and intensity of convective storms directly. It helped the forecasting process, of course, by telling us, with increasing accuracy, the broad regions where storms might occur, but no more, for the simple reason that they were not designed to do so. They were not designed to ‘resolve’ the storms. Beyond that simple statement, as a result, they were explicitly designed to prevent such storms from occurring, by recognising the atmospheric instability that produces the convective clouds and removing it, in a way designed to try to mimic the way that convective clouds remove the instability.
We often talk about model resolution in the same way as we talk about the resolution (in megapixels) of our digital cameras. This may convey some sense of what is going on, but the idea that there is some underlying ‘full-resolution reality’ over which our model averages is not a helpful way to understand how the model works. We may be trying to predict such an average, but we have nothing to average over, and so have to predict how the average will change in the future knowing only our best estimate of the average now and without any knowledge of the complex flows, such as thunderstorms, happening within our ‘pixels’. This process is known as ‘parametrization’.
A major consequence of this is that our models cannot always behave correctly. In particular, they fail to recognise the interaction between storm flows that can lead to organised and relatively long-lived systems of intense rainfall called ‘mesoscale convective systems’ or MCSs. These represent one of nature’s finest examples of order growing out of chaos.
For example, a small but intense MCS formed from isolated convective showers during the late afternoon and evening of 13th June 2014, propagating slowly south and finally crossing the south coast at about 0500 UTC (Fig. 1). By midnight it had formed an organised system shown in Fig. 1. This shows the radar-derived rainfall rate compared with forecasts of rainfall rate from the convection-permitting UKV (1.5 km) model and the convection–parametrizing Global (25 km) model. The latter, rather than forming an intense organised system, indicates convective showers which die out as the solar heating wanes.

Figure 1: Radar-derived rainfall from 13-14th June 2014 showing the evolution of an MCS over central Southern England.
So, when we made the decision to design weather forecast models that actually simulate thunderstorms, we entered a new era. This era has many similarities with the early days of numerical weather prediction (NWP). The objects of interest (thunderstorms) are grossly under-resolved, with consequent systematic errors in timing and development (Lean et al., 2008; Stein et al., 2015). Sometimes events are very poorly forecast. Nevertheless, forecasts are useful. We are beginning to learn when to rely on them and when not to. We should hope and aim for future improvements, including those that will arise from the FRANC project. It is, perhaps, no coincidence that the first new forecast product to emerge from the new forecast system was the ‘Extreme Rainfall Alert’.
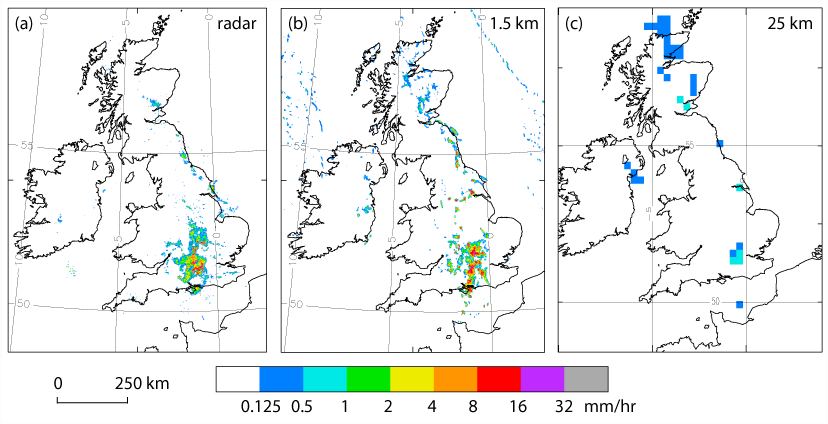
Figure 2 Mesoscale Convective System (MCS) over the UK represented by instantaneous rainfall rates (mm hr-1) for 0000 UTC 14th June 2014. (a) Radar-derived rainrates at 1 km resolution (b) UKV MetUM T+9 forecast started at 1500 UTC 13th June 2014 and (c) Global T+12 forecast started at 1200 UTC 13th June 2014.
There is, however, one difference in characteristics we have to learn to appreciate fully. The lifetime of an extra-tropical cyclone is a couple of days. That of a thunderstorm is only a couple of hours. We might realistically expect to be able to follow the lifetime of one thunderstorm in a forecast model, but only if we can detect it early enough and persuade our model to start generating a storm in the right place at the right time. The perhaps 6-hour time window we might use to detect how a cyclone is beginning to develop might be equivalent to 15 minutes to see the early stages of convective cloud.
At present we have remarkably little observational information to enable us to do this. Weather radar is our most powerful tool, and much of FRANC is devoted to making the most of the information we get from it. But most of the information we get from it relates to quite late in the lifecycle of storms. We need other information about clouds and their precursors for a realistic forecast system.
We can have little expectation of forecasting exactly what happens beyond, or even during, the lifetime of a single convective cloud; the knock-on effects of evaporation of cloud and rain, interaction with the surface etc. etc. are far too sensitive to predict exactly. (The structure of the MCS in Fig. 2 is not well-forecast 9 hours ahead). We have to make use of probabilistic forecasts, generally by means of ensembles of forecasts. The key requirement is that such ensembles accurately represent the true uncertainty in a forecast. At the same time, we will have to learn (and then teach others!) how to interpret and use what will, on the face of it, appear to be very low probabilities. There is a huge difference between predicting the probability of a 1 in 100 year event at a given place (e.g. a few streets in a town) and the probability of such an event, say, somewhere within 10 km of that place.
References
Lean, H. W., Clark, P., Dixon, M., Roberts, N. M., Fitch, A., Forbes, R. and Halliwell, C. (2008) Characteristics of high-resolution versions of the Met Office unified model for forecasting convection over the United Kingdom. Monthly Weather Review, 136 (9). pp. 3408-3424. ISSN 0027-0644 doi: 140.1175/ 2008MWR2332.1
Stein, T., Hogan, R., Clark, P., Halliwell, C., Hanley, K., Lean, H., Nicol, J. and Plant, B. (2015) The DYMECS project: a statistical approach for the evaluation of convective storms in high-resolution NWP models. Bulletin of the American Meteorological Society. ISSN 1520-0477 doi: 10.1175/BAMS-D-13-00279.1


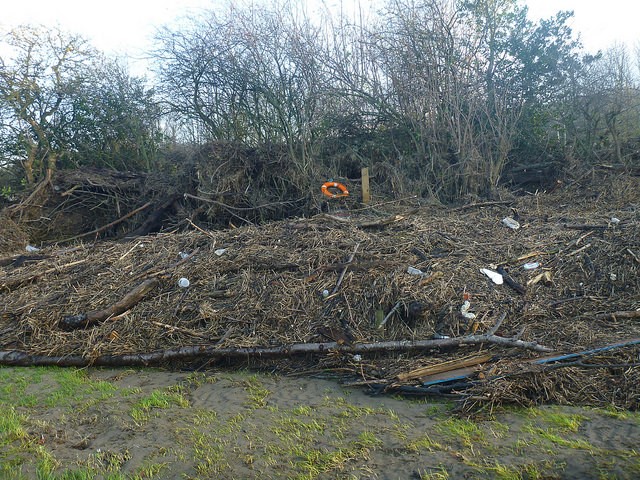
 (Photo courtesy: Silke Zollinger)
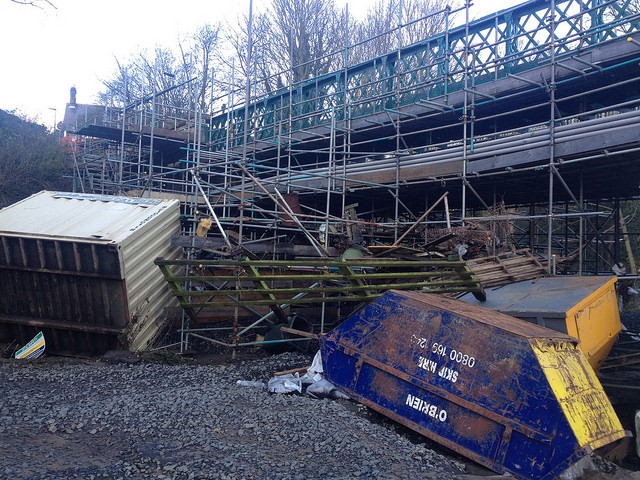
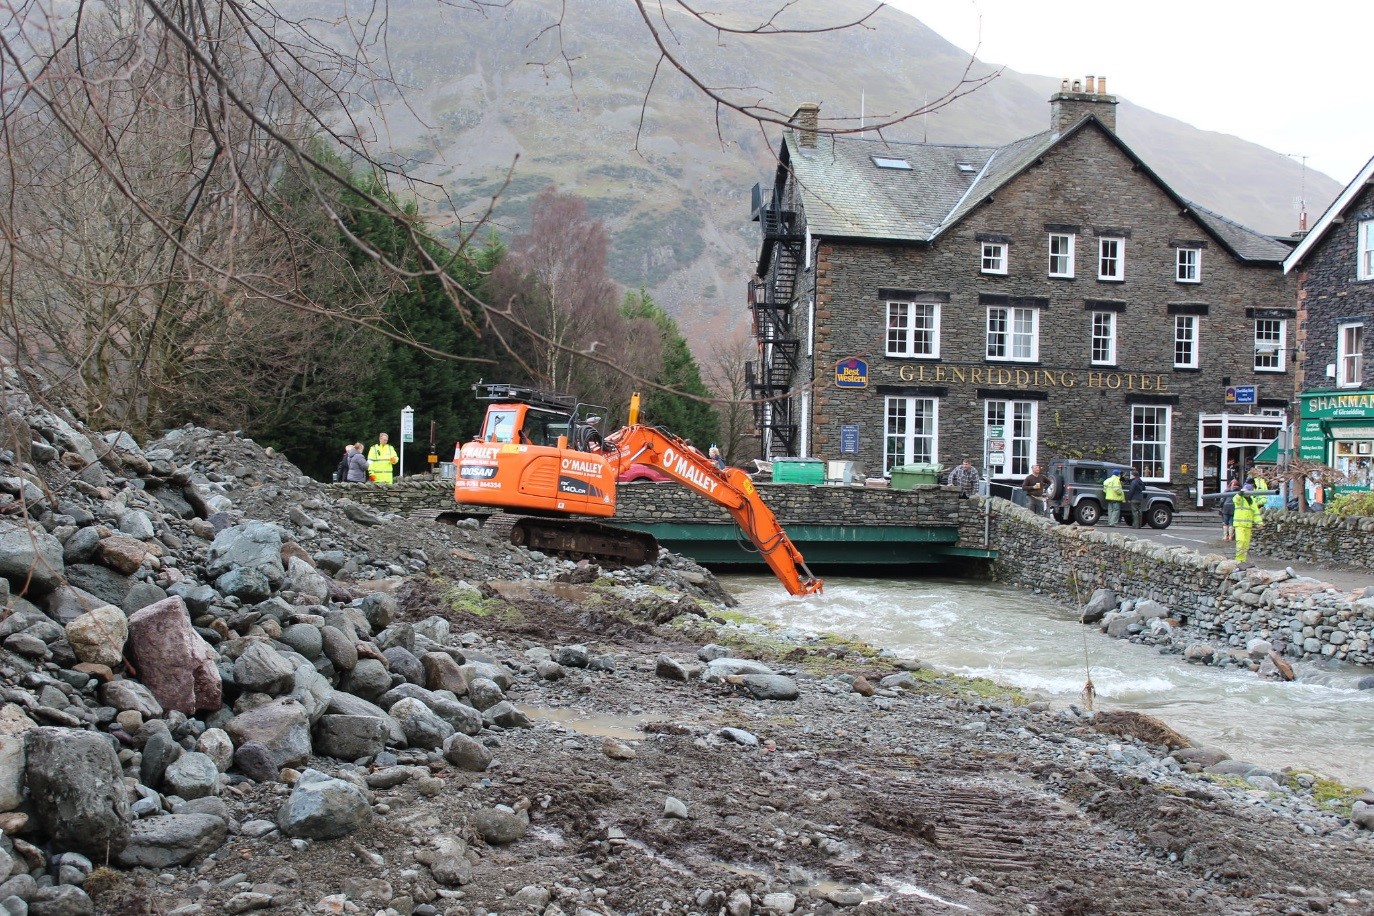
 (Photo courtesy: Florian Rathgeber)
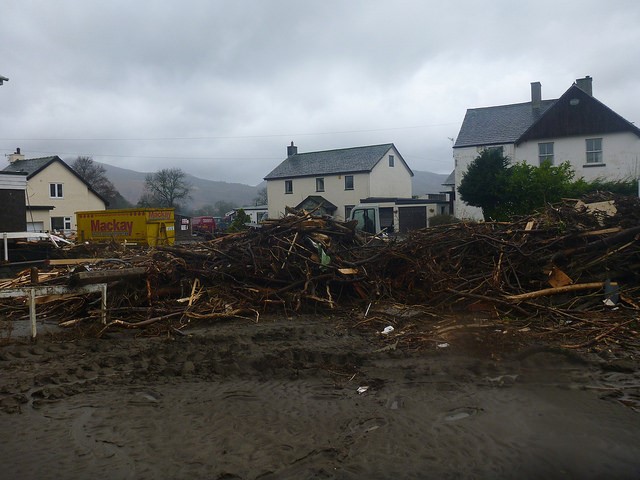
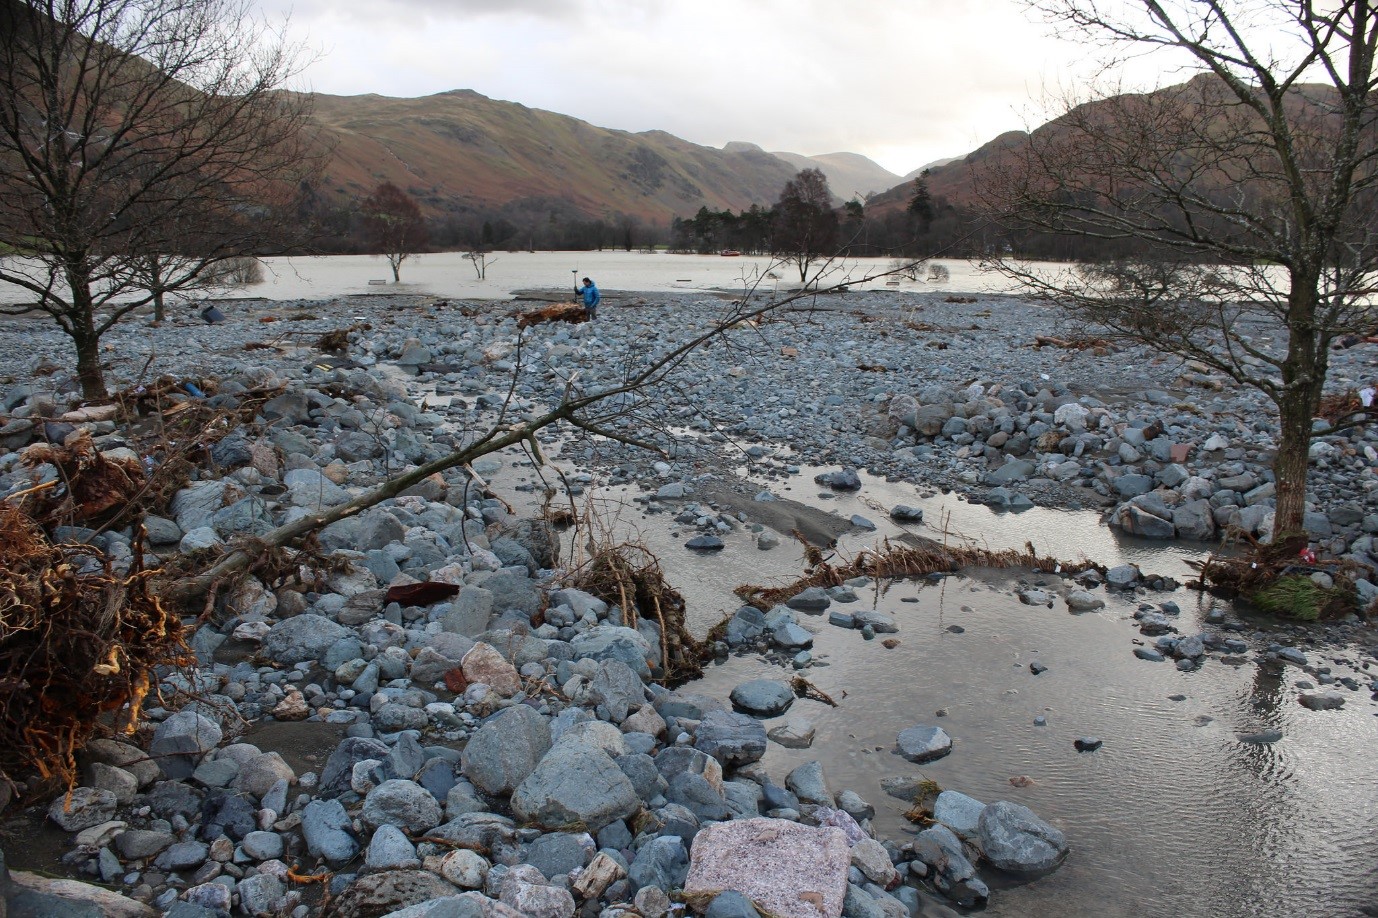
 (Photo courtesy: Florian Rathgeber)