For a stratospheric scientist, winter is a worrying time. For most of the year we can enjoy whatever weather the atmosphere decides to throw at us, secure in the knowledge that none of it is our fault. But occasionally winter throws in a surprise, and one glance at last weekend’s weather forecast tells you that this is one of those years: Squeezed between the icy graphics and blue-tone temperatures was an unequivocal message: this time a Stratospheric Sudden Warming is to blame.
Sudden Stratospheric Warmings (SSWs) are conjured from the darkness of the winter polar stratosphere. Without the Sun’s energy, the ozone-rich air can’t maintain its characteristically high temperatures, and a cold pool develops over the pole, contained by strong cyclonic winds from the temperature gradient. But the vortex isn’t left to its own devices. Planetary waves can propagate from the troposphere, and slow the vortex as they break. As with the winds of a surface cyclone, this creates convergence; in the stratosphere air is forced to descend, and adiabatically warm.
The majority of SSWs are minor, but occasionally the westerly winds can be slowed so much that they reverse – the definition of a major warming. Major warmings are a Northern Hemisphere phenomenon; on average there are 6 a decade, but only one has ever been recorded in the Southern Hemisphere. With very little land mass to the Antarctic stratosphere is starved of that key ingredient for SSWs – planetary waves. (This too is why the Antarctic ozone hole is so much larger than its Arctic neighbour; with such a strong vortex there is little dilution of cold-pool air, so destroyed ozone can’t be replaced.)
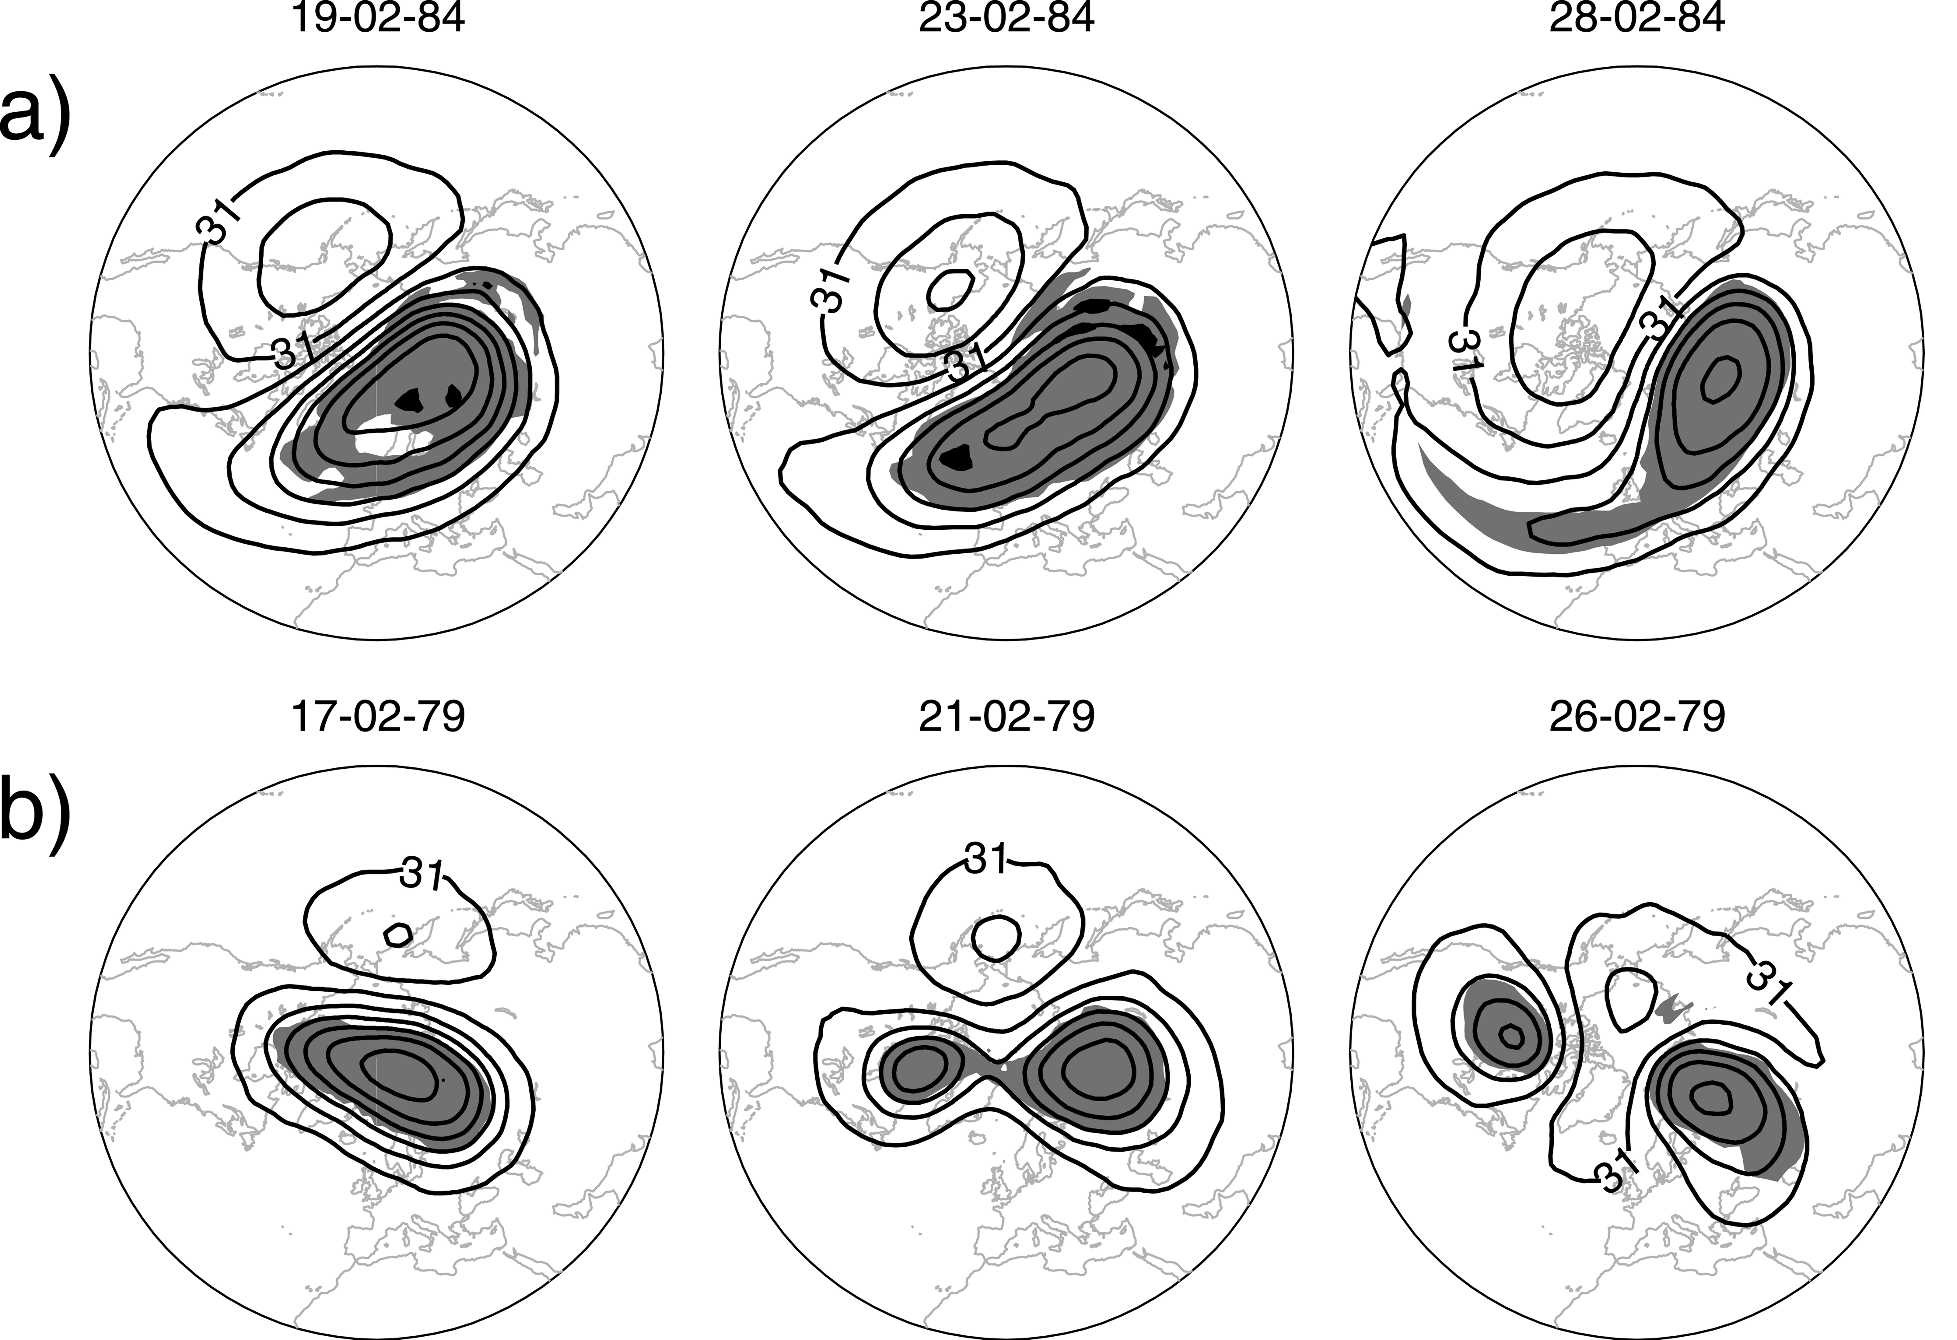
It’s important to remember that the pace of the stratosphere is slower than the transient weather systems below. Though SSWs only hit the headlines in the past few days, they’ve been above our heads for several weeks. Turn back the calendar to 2012, and the first was in full swing just as we were throwing the turkey in the oven on Christmas day. This was a vortex displacement, where the whole vortex moves equator-ward, taking on a distinctive comma shape (Figure 1.a), and it persisted for over a week, before the vortex started to recover. The second type of warming, a vortex split (e.g. Figure 1.b), was just around the corner, with an onset date somewhere around 6th January. In fact, this wasn’t so much a split as a complete disintegration. Either way, the result was the same; significant down-welling of air, and a warming of the upper and middle stratosphere.

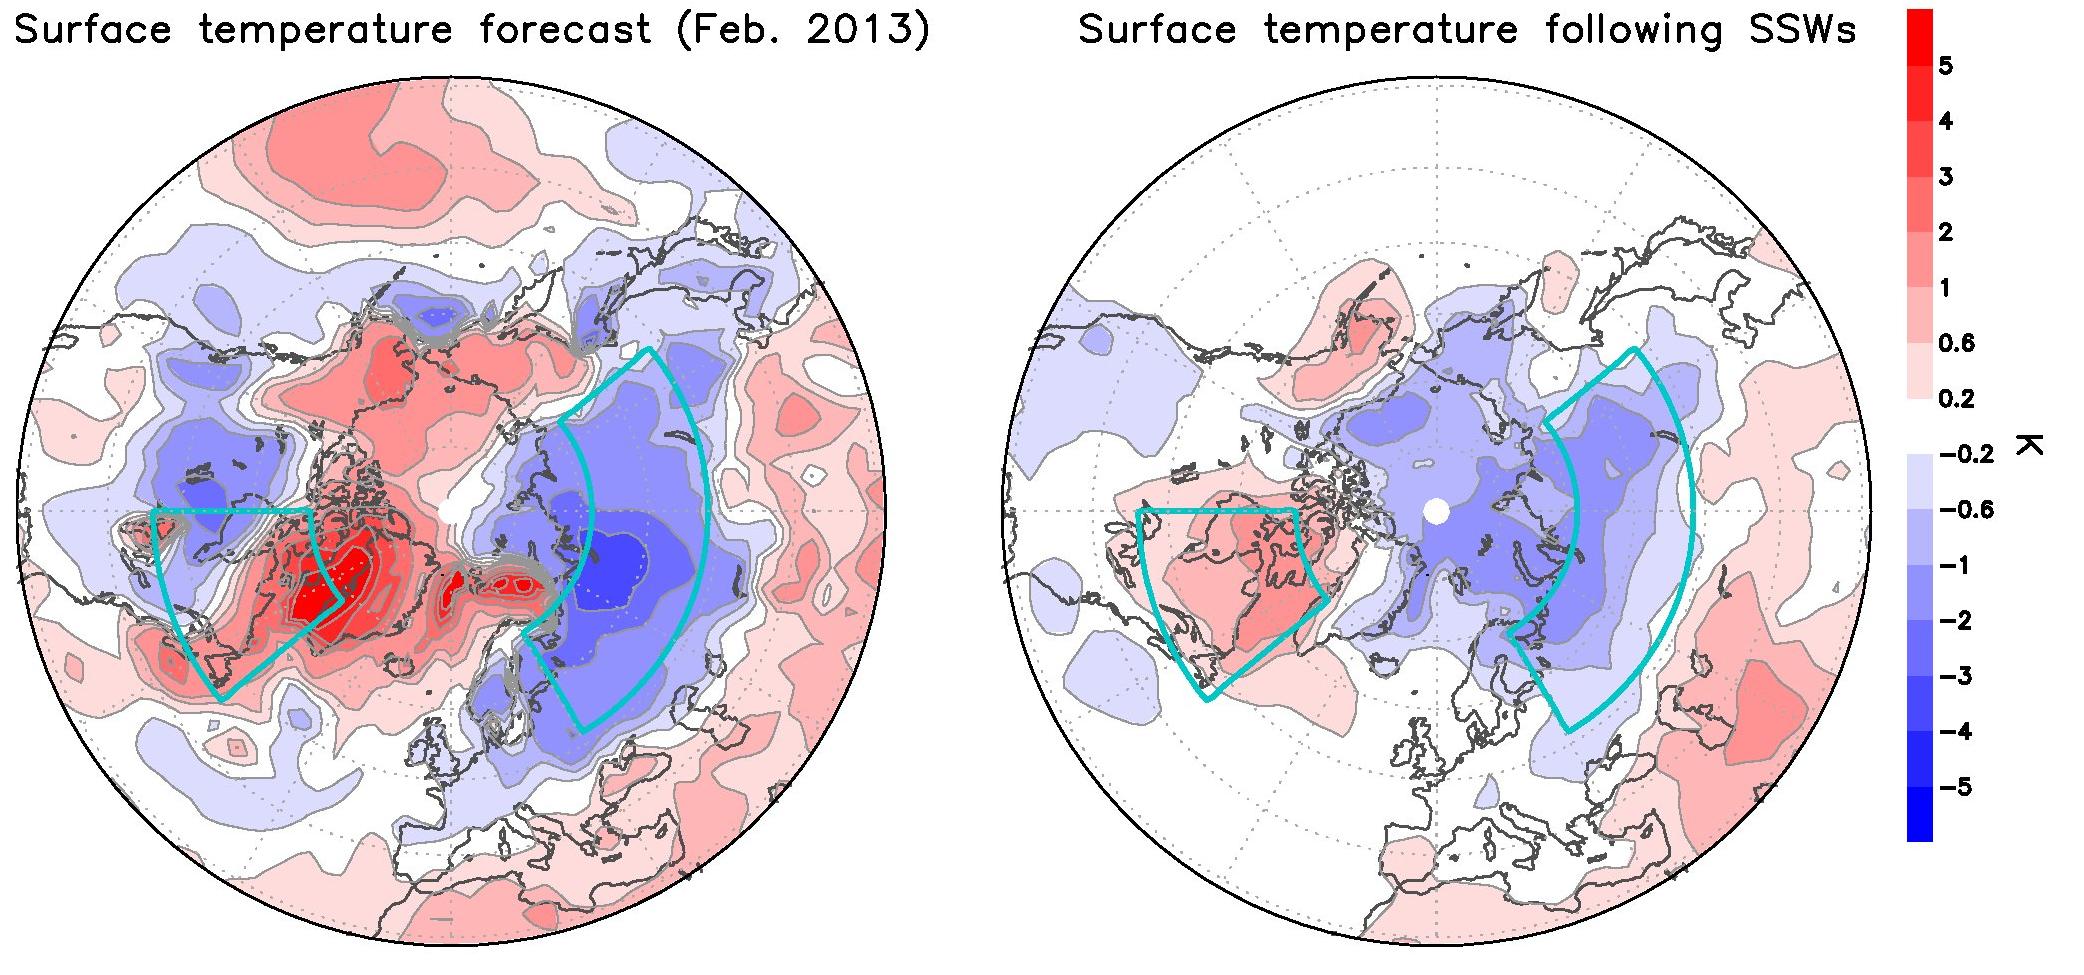
With those sorts of time scales, it’s clear that the effects at the surface aren’t instantaneous. It takes about 15 to 20 days for an SSW to express itself in our terrestrial weather, but when it does, the changes can be dramatic. Weaker polar vortices can generate surface anomalies very similar to those of the negative phase of the Arctic Oscillation (a cooling at most mid-latitudes in the Northern Hemisphere, with a warming in Eastern Canada) (Figure 2.b). Atlantic and Pacific storm tracks also tend to move equator-ward. A weaker polar vortex/SSW won’t always generate such changes, but this time it has, and they show all the signs of lasting: Figure 2.a shows predicted Northern Hemisphere temperature anomalies for February, from the Canadian Middle Atmosphere Model.

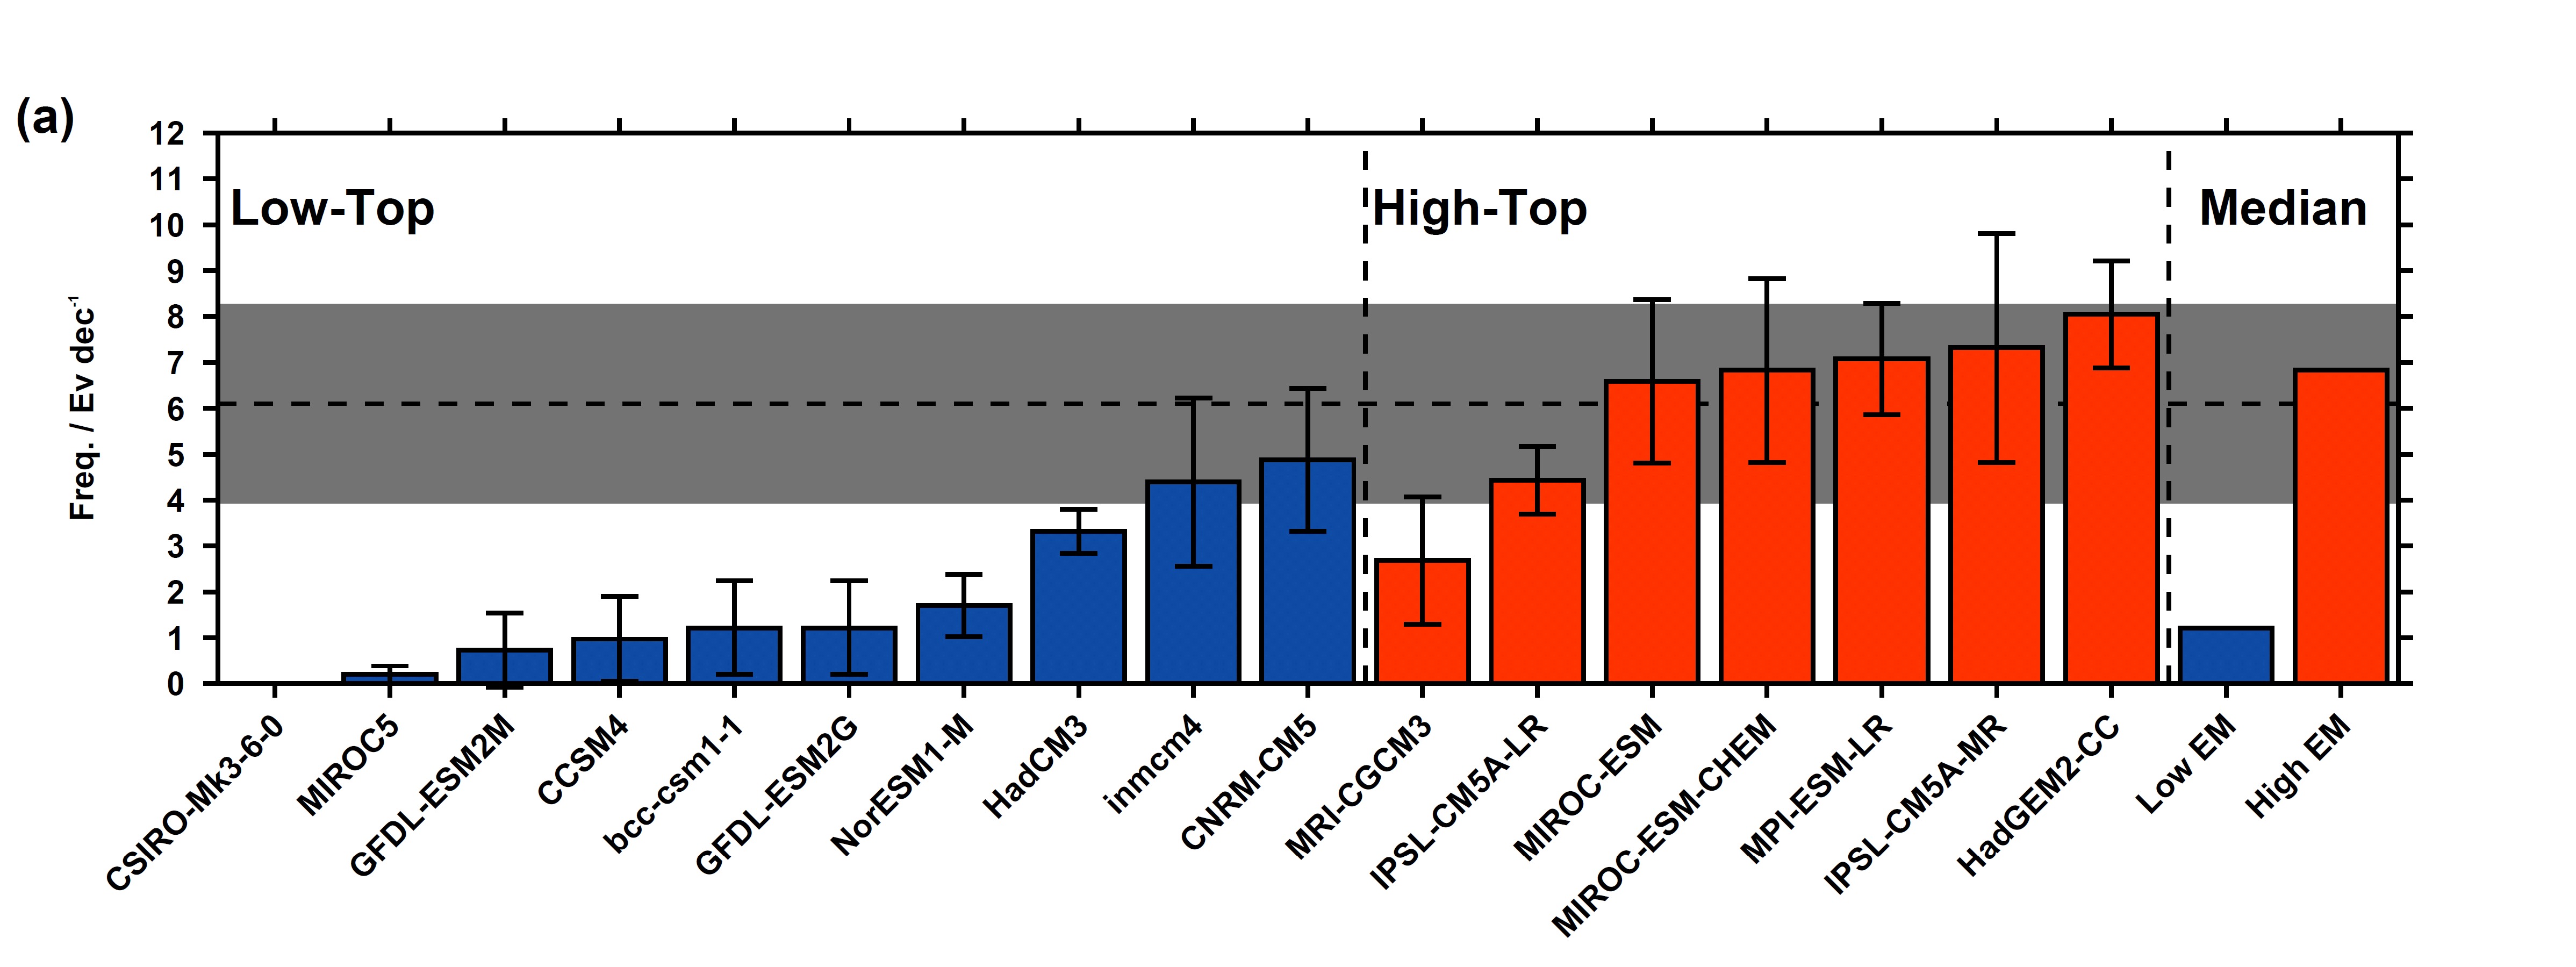
But how confident can we be in such long-term predictions, when most of us will have noticed the forecasts for the next couple of days fluctuating wildly? Though we may have lost the short-term detail, medium-range forecast can actually improve if you pick the right day to start your model! 10 to 60 day forecast skill improves significantly if you initialise a forecast during an SSW. There are implications for the type of model you choose too. Those with poorly resolved stratospheres struggle to replicate SSWs (Figure 3); better then to opt for a ‘high-top’ version, if you want to capture the intricacies of the stratosphere.

But what of the current sudden stratospheric warming? Whilst we can forecast the onset of SSWs with reasonable accuracy, the recovery is something of a dark art. This time last week, I wrote a summary of the ECMWF forecast for colleagues who are making stratospheric measurements in Southern France. It concluded that a vortex recovery seemed to be well underway; the next day’s forecast showed the vortex disintegrating again, and there’s been little improvement since. Either way, this bout of stratospheric weather is likely to continue for a couple of weeks at least, as it continues to work its way to the surface. Until then, you’ll find stratospheric scientists locked in their offices, nervously waiting for spring.
Why does short term forecast reliability go out the window during a SSW?