The first five months of the year in Reading had been cool – with an average temperature 1.8 degC below normal. After the coldest May in Reading for 17 years, June continued in the same vein – being 0.9 degC colder than average and the coldest June (along with June 2012) since 1991. However, in contrast to June 2012, June 2013 was dry with just 21 mm of rainfall making it the driest June since 2010. The lack of rain was not associated with a lower-than-normal cloud cover and June was slightly duller than average – and duller than in both April and May this year.
But things were to change in July.
The weather station at the University of Reading recorded its third sunniest month in July since sunshine records began in 1956. A total of 297.6 hours of bright sunshine was measured with the station’s Campbell-Stokes sunshine recorder – only a few hours less than were recorded in July 1959 (298.2 hours) and June 1975 (305.6 hours). With little rainfall on the 31st it had seemed at one stage as if the ‘magical’ total of 300 hours might have been exceeded – but it was not to be, as the sky remained rather cloudy throughout the last day of the month and only 24 minutes of sunshine occurred. Cloudy skies on the 2nd and 3rd also helped to keep the total lower than it might have been.
During the peak of the sunny conditions there were 15 consecutive days (from the 5th to the 19th) with over 9 hours of sunshine – the longest such spell in July on record. In addition, from the 7th to the 13th every day had over 12 hours of sunshine – this has only been bettered (by longer such spells) in any summer month on three occasions since 1956.
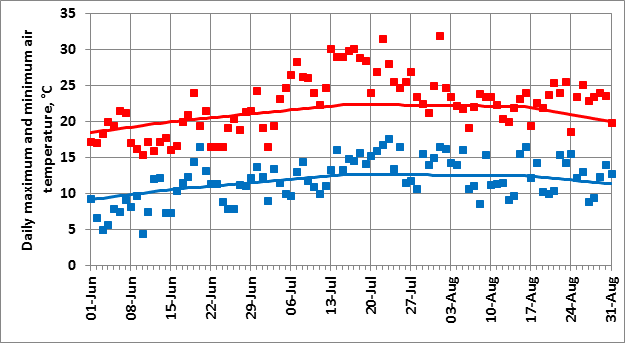
With an average temperature of 19.5 °C it turned out to be the warmest July since July 2006 (which was the hottest July of the past 106 years at the University). Temperatures reached 30 °C on three days, peaking at 31.5 °C on the 22nd – the highest temperature in Reading since July 2006. There were also some warm and humid nights during the month – overnight 22nd/23rd the temperature did not fall below 17.6 °C in Reading. Daytime maximum temperatures were conspicuously above average from the 4th to the 27th – see Fig.2 which shows the daily maximum and minimum temperatures recorded at Reading – and also the climatological values (solid lines).
July’s summery weather was the result of a persistent area of high pressure which remained over us for almost three weeks. After 1.8 mm of rain on the 2nd, the raingauge at the University of Reading remained dry (apart from some light spots of rain during thundery weather on the 23rd) until the 24th – this was the longest period of summer drought at the weather station since August 1995.
After the high pressure moved away from southern England we had five days with thunderstorms in and around Reading. However, rainfall amounts were mostly slight apart from a fall of 15 mm on the 29th; the total fall for the month of 34.9 mm was less than average and made it the driest July since 2006.
Conditions in August continued the dry theme – just 20.8 mm of rain fell in Reading, the driest month since March 2012 and the driest August since 2003 (when 14.2 mm fell). There were no thunderstorms in August and the wettest day (the 5th) brought just 5.9 mm of rain as the town missed the heavy falls that affected places to the east.
The mean August temperature was 0.6 degC above average although.,apart from on the 1st (when 32.0 °C was recorded – the highest temperature of the summer in Reading), the temperatures during August were never that far away from the average. August was the warmest since 2004 – but this was more a reflection of the lack of hot Augusts in recent years than in any prolonged heatwave this month. 224 hours of bright sunshine in August made it the sunniest August since 2005.
So how does this summer compare to others?
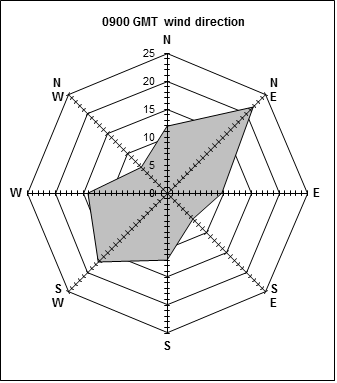
Overall it was the warmest, sunniest and driest summer (June-August) since 2006 (which in turn was 1.3 degC warmer). Air pressure was on the high side overall (the anomaly was +2.6 mb compared to the 1981-2010 average), consistent with the reduced rainfall total given the lack of heavy thundery downpours – and was also associated with an increased tendency towards a flow from a NE’ly direction at times.
Poulter (1962) [Poulter R.M. ( 1962), The next few summers in London, Weather, 17, 253-257] devised a (possibly controversial) summer index as a way of combining the elements of average temperature, rainfall and sunshine into a single value to denote the ‘goodness’ of the summer. Essentially the range of these three elements are scaled to value of about 70, and then the elements are combined such that sunshine and temperature make a positive contribution, and rainfall a negative one, to the index.
Using summer totals of sunshine and rainfall and mean summer air temperatures for the period 1968-2012 (during which the ranges from best to worst summer were 221.7 mm, 396.6 hours and 3.85 degC respectively), we can derive the Poulter Index (P) for Reading as follows:
P = 18.18T + S/5.67 –R/3.65
where T is the average temperature (°C), R is the total rainfall (mm) and S is the total sunshine (hours). Allowing for an average summer temperature difference of 0.6 degC between Whiteknights and London Road we can calculate the Poulter Index as shown in the figure for the period 1959-2013:
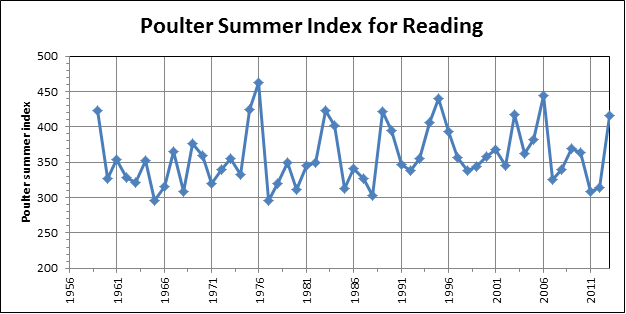
This confirms that the summer of 2013 in Reading might be considered as the best since 2006 – and similar in some ways to the summers of 2003, 1989, 1983, 1975 and 1959. It was certainly an improvement on those of 2007-2012.
Acknowledgements
Thanks to Mike Stroud and John Lally in particular for making the observations every day.