
One of the good things that can now be found on the web is a complete series of the Met Office’s Daily Weather Report going back to 1860. An overview of the early history of the report can be found on the Met Office’s web site. The reports themselves are available at the Met Office Digital Library and Archive.
On discovering this resource a few months ago, the first thing that I wanted to know (after finding out the weather on my birthday) was when fronts first appeared on the charts in the reports. Jon Shonk wrote about fronts on this blog in 2014. Although the concept of a weather front dates back almost a century, it still plays an important role in understanding mid-latitude weather systems.
The following images sample the evolution of the charts in the Daily Weather Report from the first charts in 1872 to a time when fronts had become an established part of the Met Office’s operations. Click on an image to see a larger version. The images show how successive generations of meteorologists have tackled the problem of presenting multiple meteorological variables in a compact, easily assimilated form. The reports also include pages of purely tabular or textual information, which are not shown here.

Figure 1. These charts are for 12 March 1872. Charts first appeared in the Daily Weather Report the previous day, but high pressure dominated then and it is doubtful that any fronts would have been shown, even if the concept had been available. On the 12th, there was low pressure to the NW of Scotland. A mixture of graphical, numerical, and verbal presentation is used, described in the keys to each of the four charts. Isobars are labelled in inches of mercury (inHg). The contour interval for isobars is not constant, being 0.1 inHg (about 3.4 hPa) in some cases, 0.2 inHg in others.

Figure 2. Twenty five years later (3 March 1897) and the four charts of 1872 have been merged into two. This has been achieved partly by omitting the attempt to show the general motion of the air and partly by replacing words with shading (for sea disturbance) or with Beaufort letters (for weather). Isobars are now regularly spaced every 0.1 inHg (about 3.4 hPa).
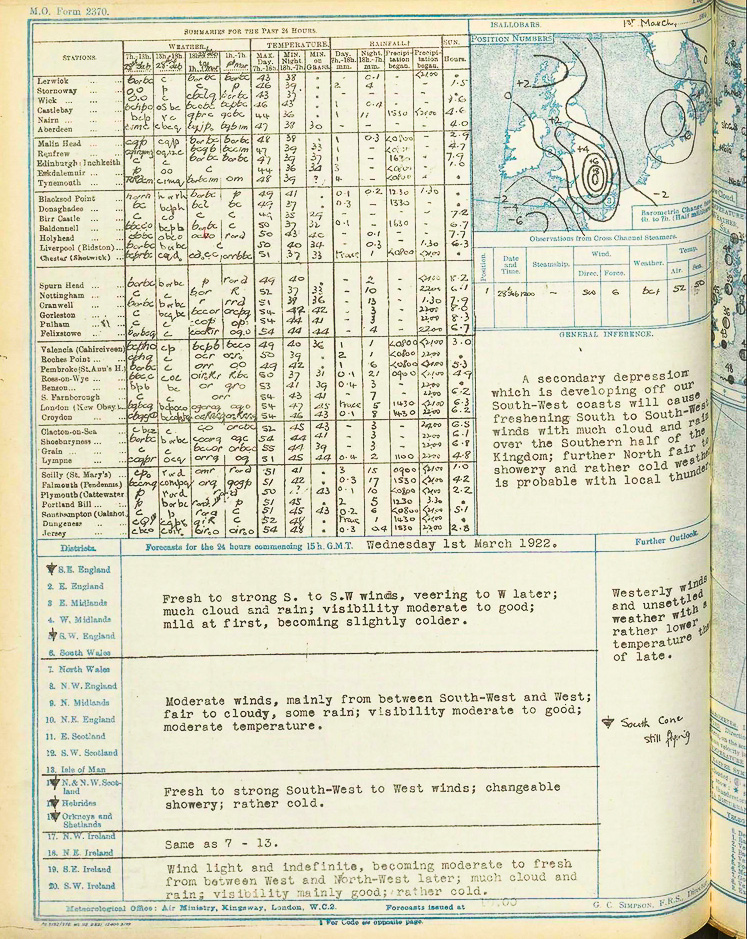
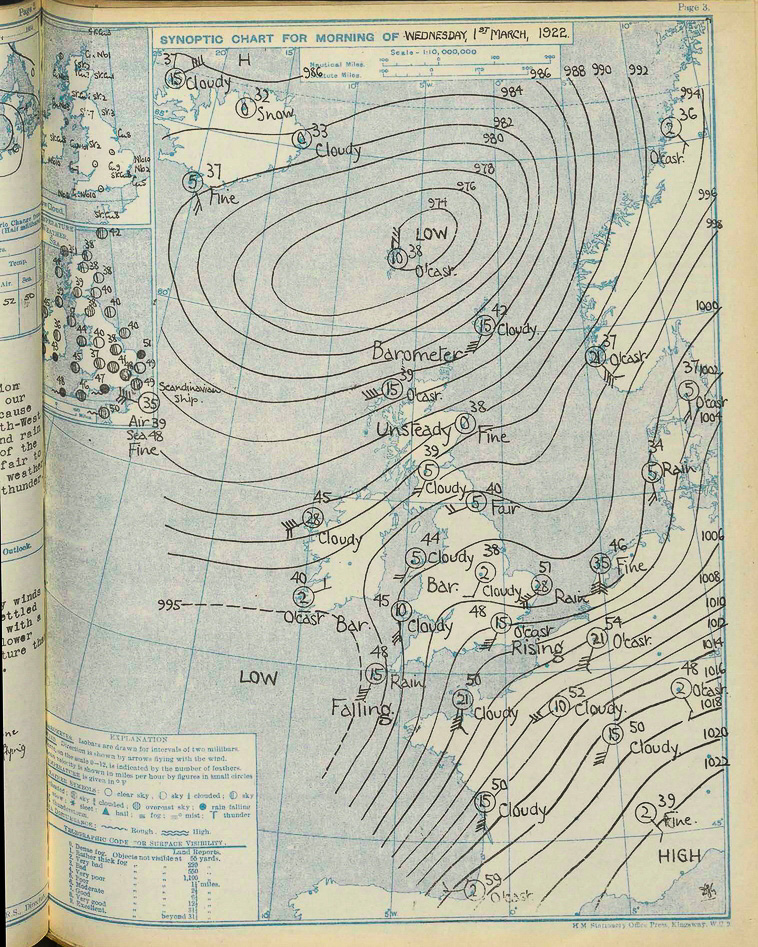
Figure 3. 1 March 1922. There is now one large main chart and three smaller ones. Since 1897, quantitative rainfall has been dropped from the variables plotted, but isallobars (contours of constant pressure change) and low cloud have been added. Isobars are now labelled in millibars and spaced every 2 mbar (1 mbar = 1 hPa). There is redundancy in this way of plotting the data: temperature, weather, and wind speed are all plotted twice. Fronts have not appeared yet, but the concept is still new.

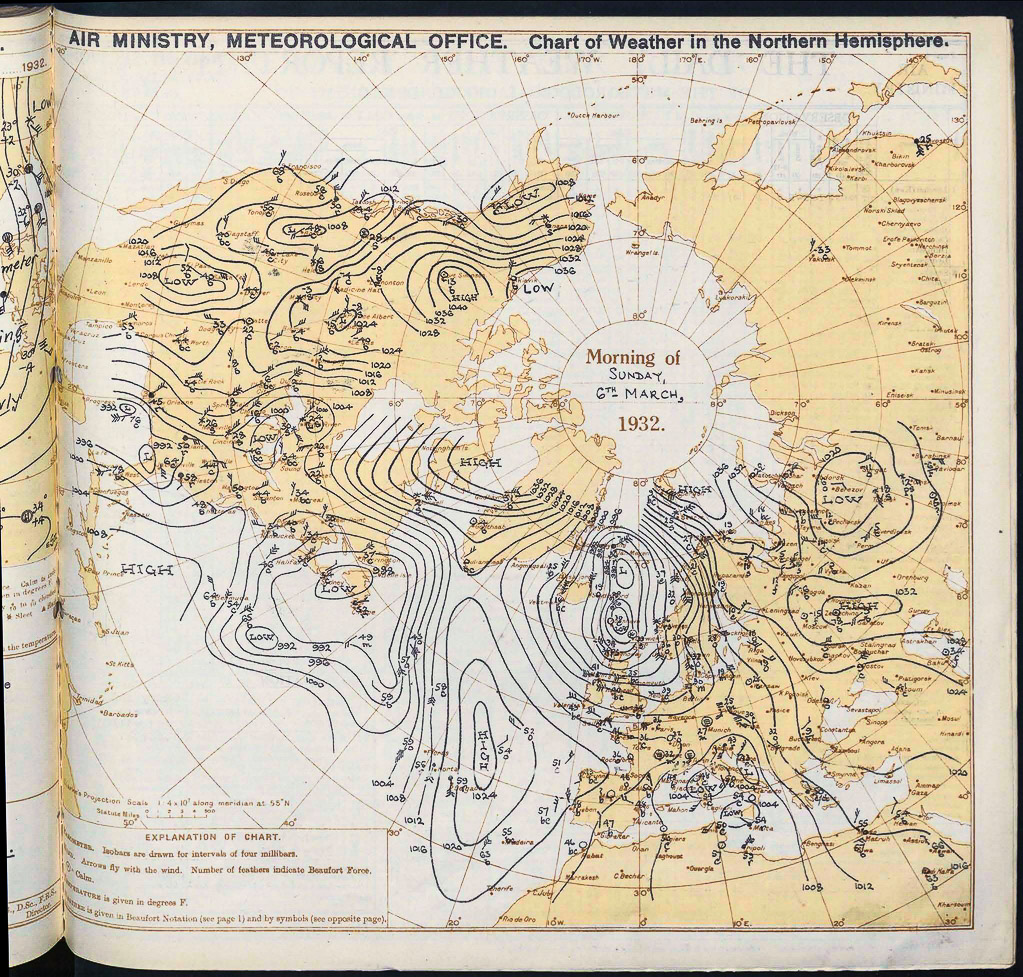
Figure 4. Ten years later (6 March 1932) and the multiple UK charts have been merged into one. Some information has been lost (such as low cloud), but in compensation there is now a full-page chart covering much of the extratropical northern hemisphere. The representation of observations on the UK chart is converging towards the idea of the station model (see Figure 7). There are still no fronts.

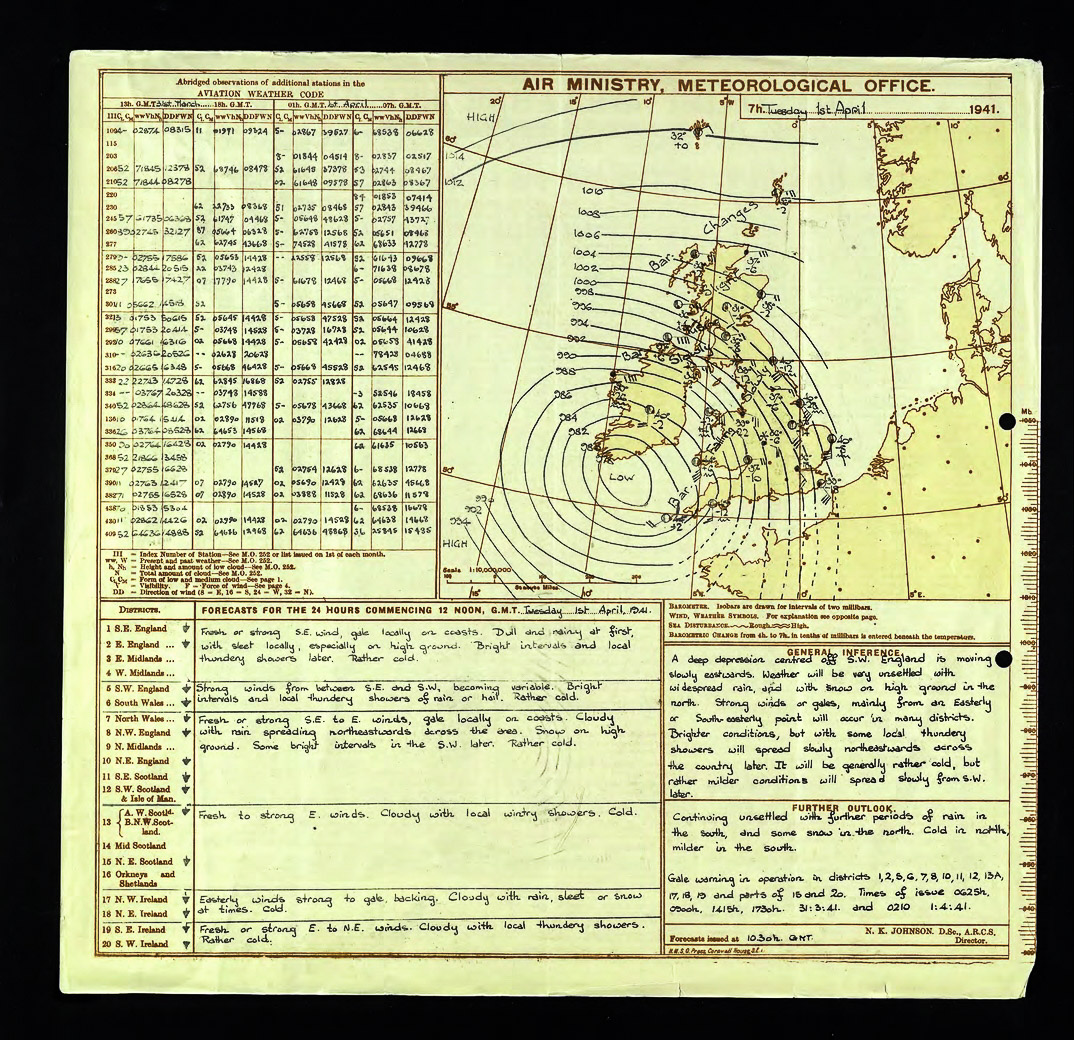
Figure 5. 1 April 1941. The style of the charts is similar to nine years ago, although there has been a change in the style of the wind arrows, and weather on the hemispheric chart is now shown using symbols rather than Beaufort letters. Wartime has brought a reduction in the availability of observations. There are none from most of the European continent. Some days there are observations from Russia, America, or the Western Atlantic, but not always (compare Figures 6 and 7). There are still no weather fronts.
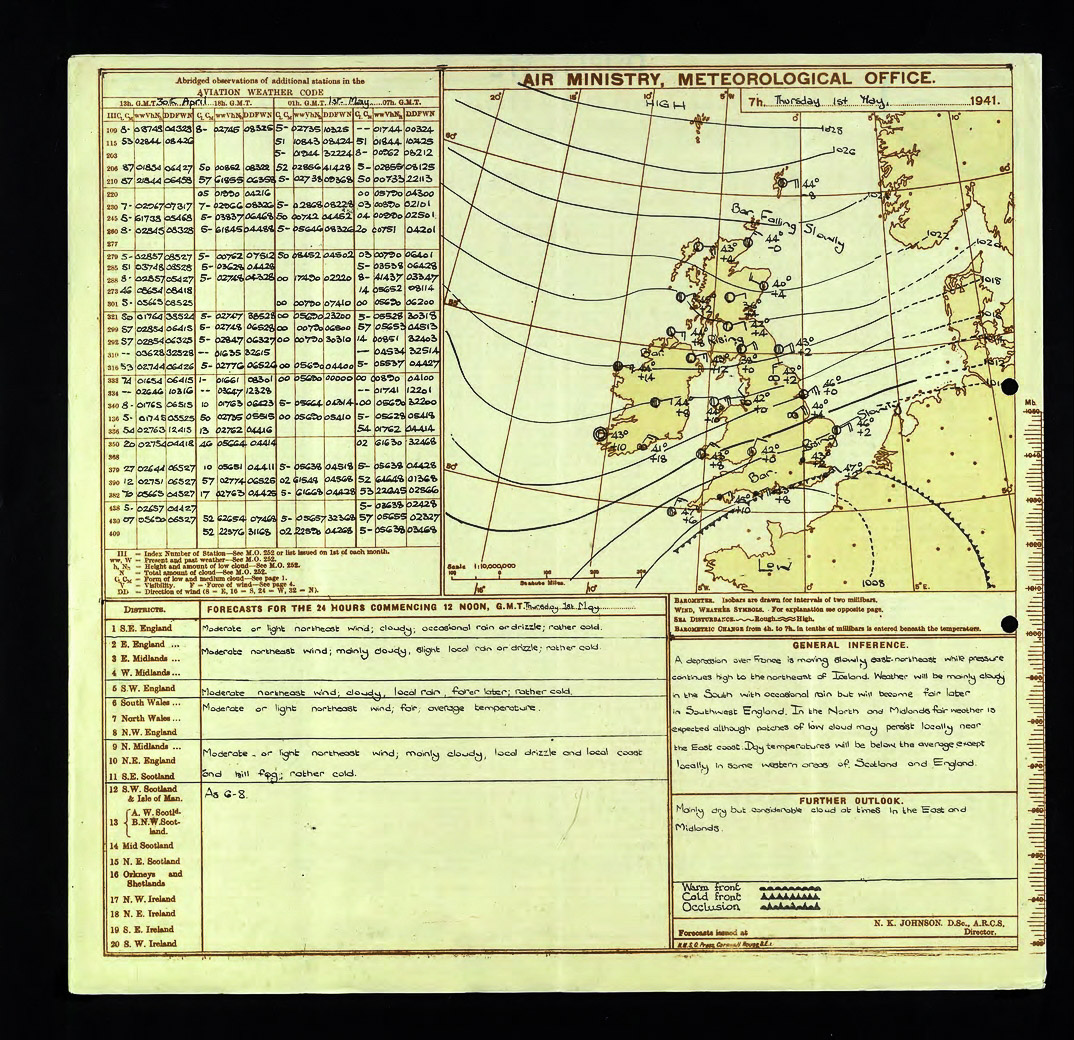
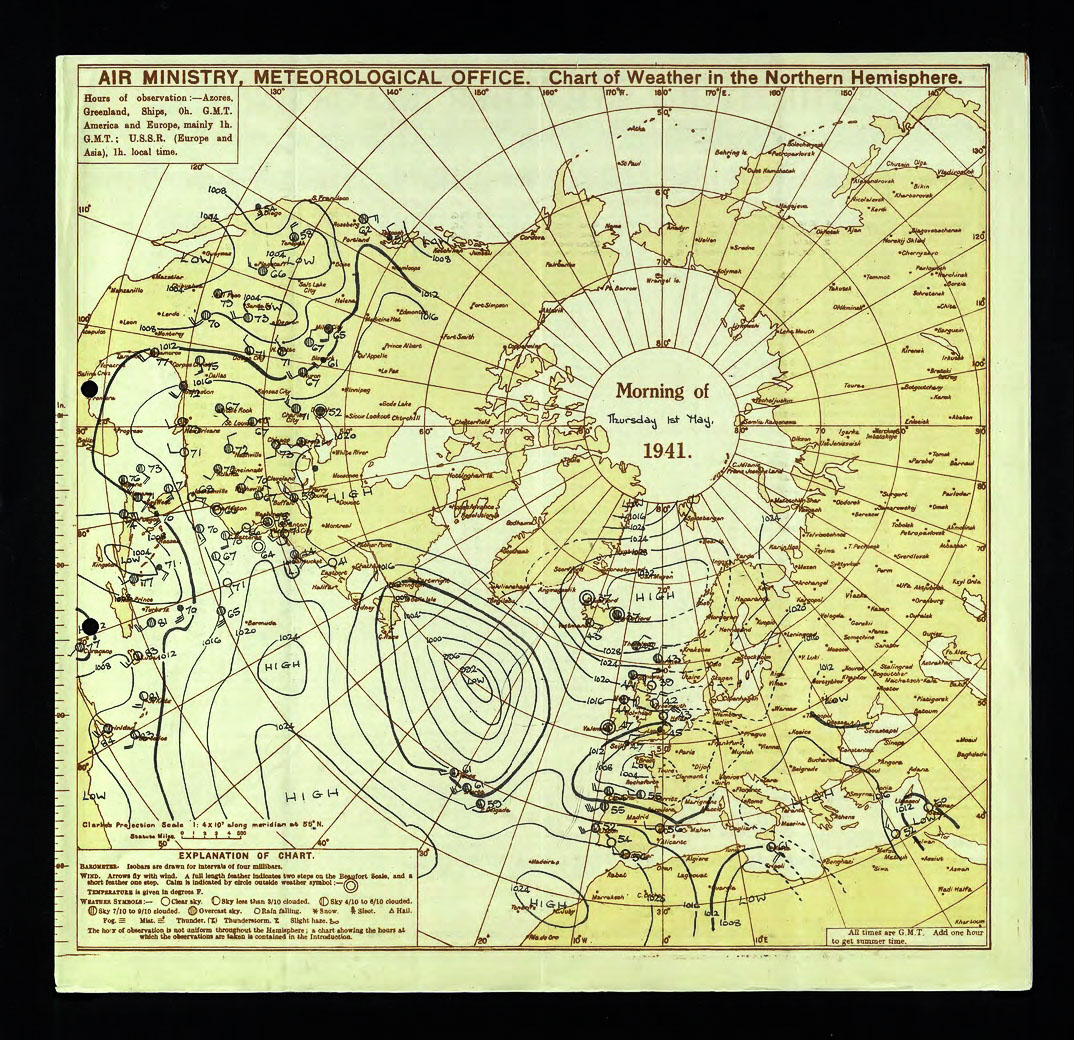
Figure 6. One month later – 1 May 1941. Look carefully and you will see the first fronts to appear in this section of the Daily Weather Report. In the SE corner of the UK chart there are two occluded fronts: one heading SE, one heading NE. A key to the fronts has been added by hand under the Further Outlook. Fronts are not yet shown on the hemispheric chart.
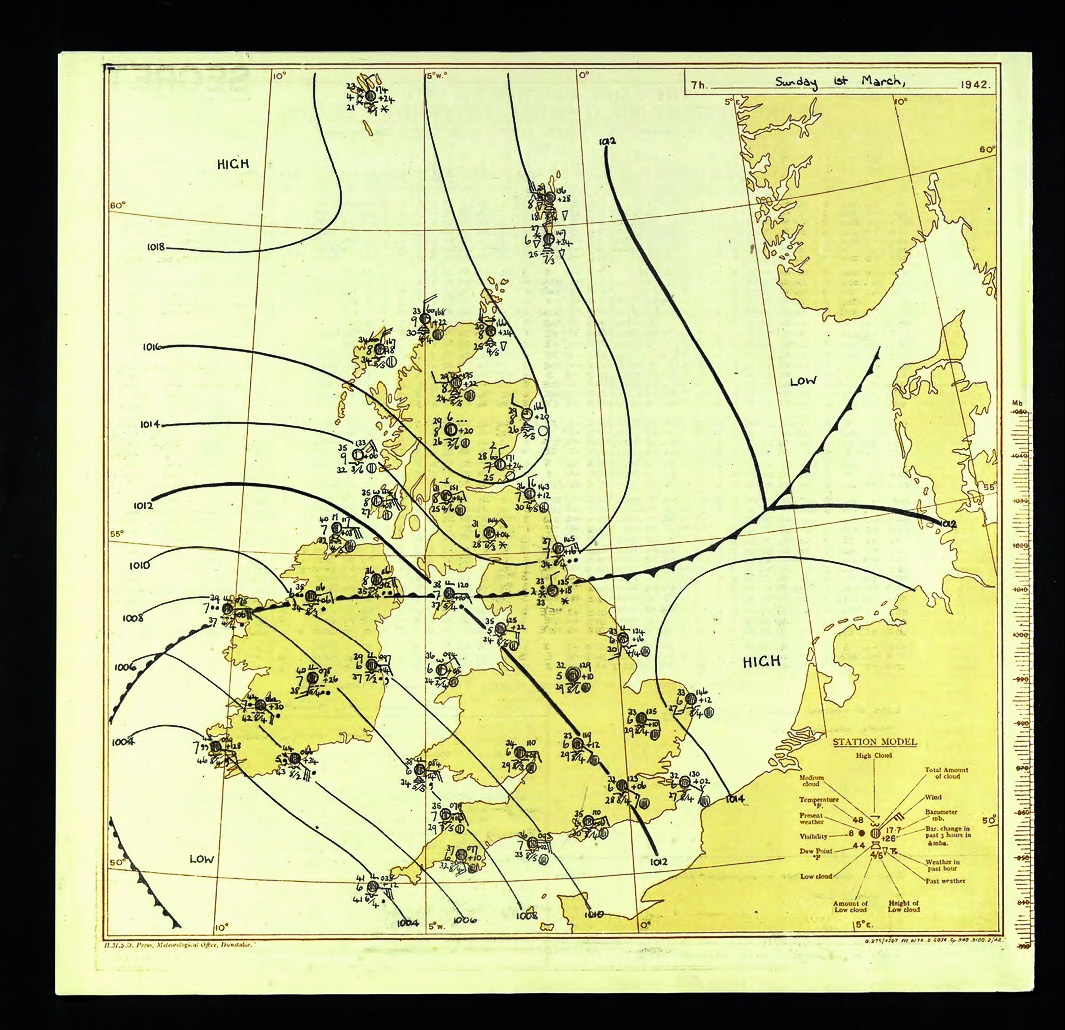
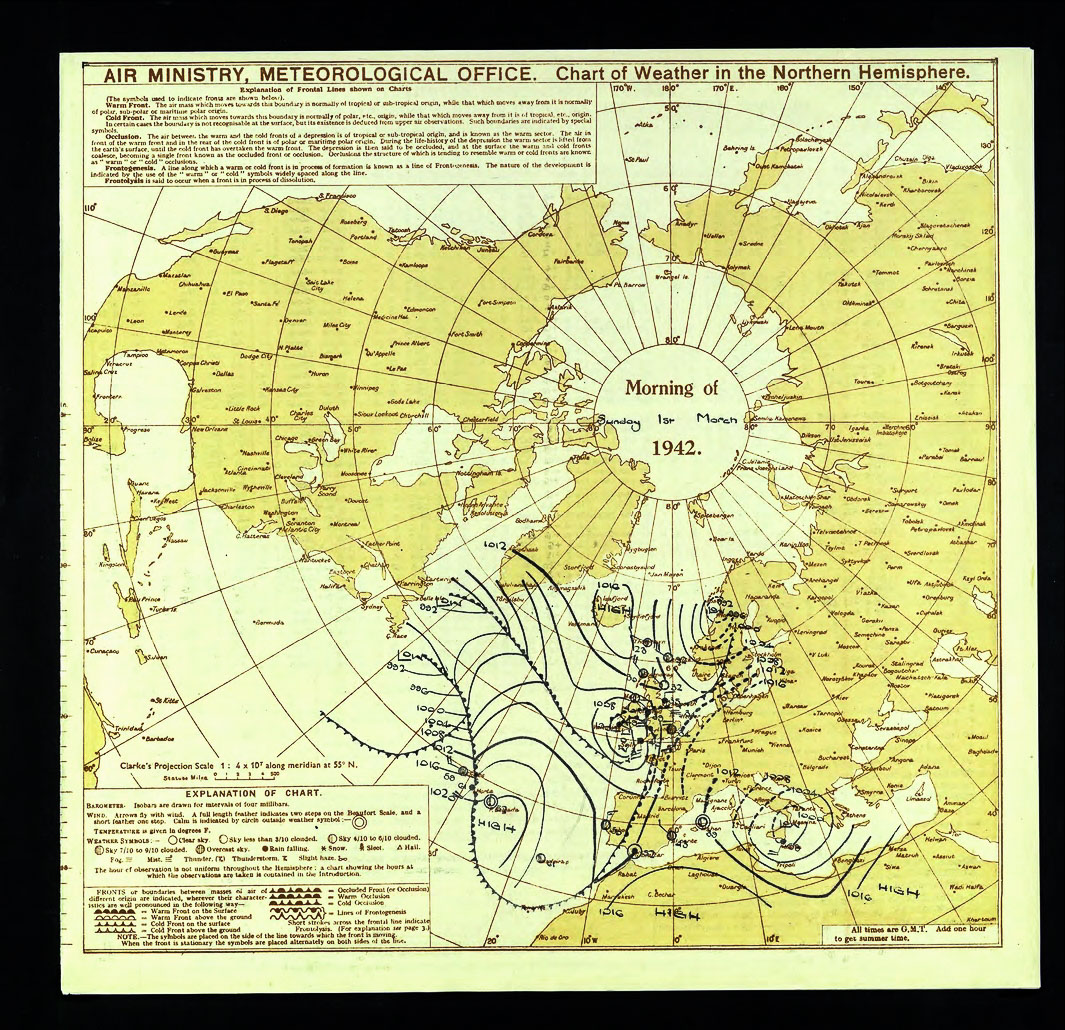
Figure 7. Ten months later – 1 March 1942. The UK chart has been expanded to a full page. A full station model has been adopted for plotting the UK observations. This enables the reinstatement of the low cloud that was lost in the early 1930s, but the sea disturbance, which had been plotted since the first charts in 1872, has been dropped. Fronts now appear on the hemispheric chart, and there is a printed key to a rather elaborate system of fronts.
Examination of the copies of the Daily Weather Report available on the web therefore gives the impression that fronts did not appear until 1 May 1941, but that is not the full story. In 1919 the Daily Weather Report was split into three sections: a British Section, an International Section, and an Upper Air Section. We have been looking at the British Section, which is the only section currently available on the web. Fronts first appeared in the International Section on 1 March 1933. Nevertheless, 1 May 1941 (75 years ago this month) is an important date, for it represents the arrival of fronts at the heart of the Met Office’s activities.