
By Robert Lee
The climate state in numerical models often have differences when compared to a climatology from observations. These differences are often termed ‘biases’ and can be considered as a kind of error or deficiency in the model. These biases are often caused by poor representation of various physical processes in the models. This poor representation in turn can be caused by a number of factors, including: poor resolution (the number of gridpoints in the model), poor parameterizations (often derived empirically to fit often limited observational data), or poor knowledge of the process itself.
Atmospheric climate model biases have been shown to be sensitive to large-scale sea surface temperature (SST) biases, for example in the North Atlantic–European region (e.g. Keeley et al. 2012; Scaife et al. 2011). The more recent generations of climate models have reduced many of these large-scale SST biases, for example in this same mid-North Atlantic region in the UK Met Office Global Coupled 2 (GC2) model (Williams et al. 2015). However, despite improvements on the largescale, spatially smaller regions of SST biases remain and when they are located in regions of deep atmosphere–ocean interactions, there is potential for a knock-on chain-reaction of biases.
The GC2 model is a popular and well regarded model and can be configured for different Met Office applications including the seasonal forecast system (GloSea5), decadal prediction system (DePreSys3) and climate projection system (HadGEM3). It also has multiple spatial resolution configurations options, with one of the most popular being around 60km grid spacing. This version has a warm bias of up to almost 7°C in the Gulf Stream SSTs in the winter season (Figure 1b) just north of where the Gulf Stream leaves the US East Coast at Cape Hatteras heading northeast towards Europe (Figure 1a). This bias is originating within the ocean part of the model but is not seen in a higher resolution version. Hewitt et al. (2016) suggested it may be at least in part due to insufficient resolution in the ocean.

Figure 1. (a) Sea surface temperatures in the ERA-Interim reanalysis, with values very similar to observations, showing the Gulf Stream with the tightest SST gradients extending east-northeast from Cape Hatteras. (b) The GC2 coupled model bias relative to ERA-Interim, showing the largest SST bias just north of the Gulf Stream by the US Eastern Seaboard. (c & d) Two of the three experimental boundary boxes with their SST differences added onto the background SST in the experiments.
This region of SST biases is associated with enhanced surface heat flux biases as extra heat is transferred from the sea surface into the atmosphere in the model. In a new study by Lee et al. (2018) we explore the role of this SST bias, focusing on the atmospheric response by performing three experiments. These experiments are known as ‘sensitivity experiments’, where the SST biases are imposed on an atmosphere-only configuration of the model over a small (Figure 1c) and medium (Figure 1d) section of the Gulf Stream, and also the wider North Atlantic.
We found that the atmospheric dynamical response to this extra Gulf Stream heating (and associated shifting and changing SST gradients) is to enhance vertical motion (Figure 2), particularly during the periods when storms pass over. We found this dominated over other mechanisms for dissipating the extra heating over other possibilities including a linear local meridional wind response (as suggested by more theoretical studies e.g. Hoskins and Karoly 1981, Hendon and Hartmann 1982, and Hall et al. 2001) or via a change in the storm track activity transporting heat polewards (e.g. Hoskins and Valdes 1990).
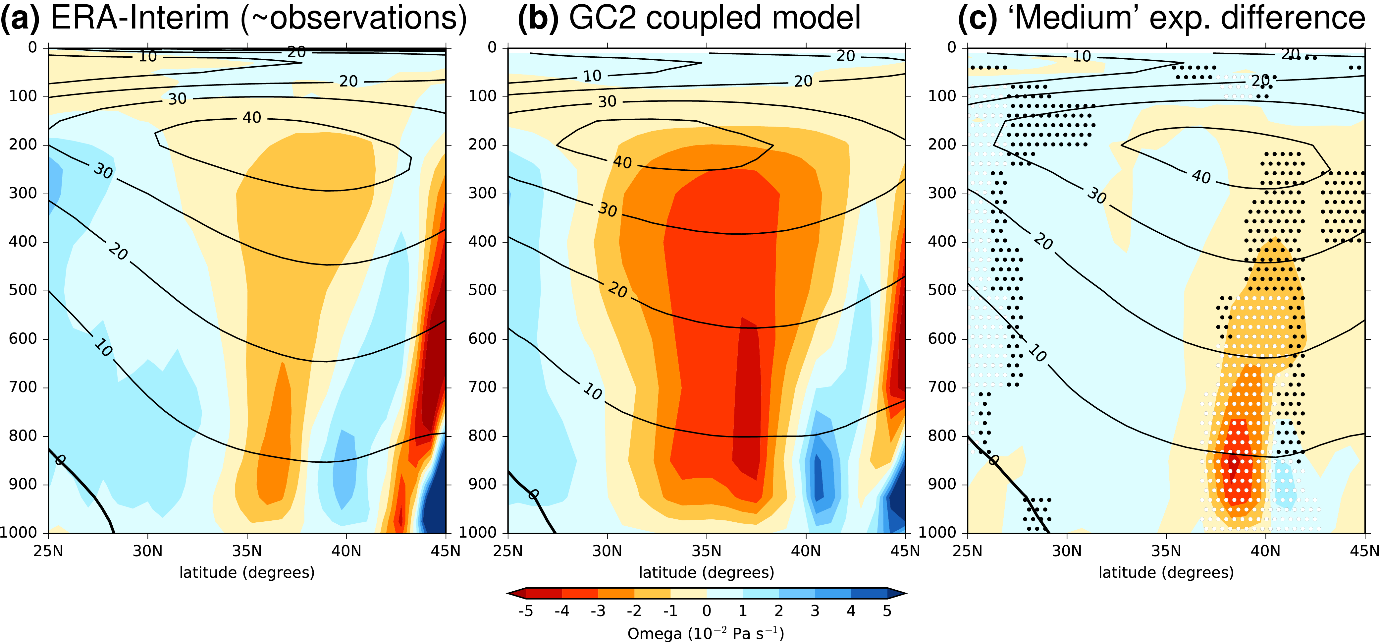
Figure 2. A north-south vertical cross section through the atmosphere over the Gulf Stream showing vertical motion (colour shading) and eastward wind jet stream (line contours, m/s): (a) in ERA-Interim, showing a narrow section of ascent directly above the observed Gulf Stream; (b) in the GC2 coupled model showing a broader and stronger region of ascent, particularly over the region of large SST bias; (c) the additional vertical ascent resulting from the ‘medium’ sized box SST bias added in to the atmospheric model.
We found the response to this extra heating affects the atmosphere not only locally over the Gulf Stream but also in remote regions of the Northern Hemisphere, thereby partially reproducing some of the biases present in the full atmosphere-ocean coupled configuration. This chain of impacts spreading from the Gulf Stream region is able to travel around the hemisphere via an atmospheric wave train, known as a Rossby wave, with a wavenumber 5.

Figure 3. (a & b) Geopotential height at 500hPa in the mid-troposphere (nearly 5km above sea level) as a proxy for large-scale circulation differences, shown as (a) the GC2 coupled model bias and (b) the ‘small’ sized box SST bias experiment, partially reproducing the negative bias over the central North Pacific and Scandinavian regions. (c) The anomalous Rossby wave train produced in the ‘medium’ sized box SST bias experiment.
The enhanced ascent (often in the storms), and wave response pathways may have implications for the ability of models to respond correctly to variability or changes in the Gulf Stream. Despite representing only a small fraction of the total wave activity, these wave-5 Rossby waves have been shown to respond sensitively to changes in forcing (Simpson et al. 2016), with important implications for regional climate. Better global prediction requires particular attention to be paid to reducing any large western boundary current SST biases in such highly coupled and sensitive regions, such as the Gulf Stream. Therefore, a focus on reducing the origins of the ocean and SST biases in these regions of high ocean–atmosphere interaction may also reduce some of the global atmospheric biases in coupled global climate models, serving to highlight and direct future development and improvement priorities.