
By Julia Curio
Tibetan Plateau Vortices (TPVs) are meso-scale cyclones that originate over the Tibetan Plateau and move eastwards steered by the subtropical westerly jet above. These storms can also move off the Tibetan Plateau (TP) and travel as far east as eastern China. There they can trigger extreme precipitation events and flooding, e.g. in the Sichuan province and along the Yangtze River valley.
Feng et al. (2014) describe a TPV event occurring in July 2008 where a TPV moved off the TP and travelled north-eastward all the way to the coast of the Yellow Sea within five days. This TPV caused heavy rainfall over a large area of southern and eastern China, especially in the Sichuan province, where the maximum 24 h accumulated precipitation at one station reached 288 mm, which is about a quarter of the average annual precipitation.
Within the MESETA project (Modelling physical and dynamical processes over the Tibetan Plateau and their regional effects over East Asia) we study TPVs in reanalysis data sets and a state of the art general circulation model (Curio et al. 2018a, in revision). We use the objective feature-tracking algorithm TRACK, developed by Kevin Hodges here in Reading, to identify TPVs and their paths. One aim of the project is to assess how well the model can represent TPVs using a 25 km horizontal resolution. Another is to connect the occurrence of TPVs to large-scale atmospheric circulation, e.g. the subtropical westerly jet and the monsoon system, and to analyse the conditions under which these systems can move off the TP and trigger extreme rainfall.
We discussed that it would be important to validate the results from the reanalyses with an independent observational dataset of TPVs before using the reanalyses to validate the model. We found out that the Institute of Plateau Meteorology (IPM) in Chengdu, the capital of the Sichuan Province, is publishing yearbooks of TPVs. These yearbooks are the only available observational dataset on TPVs, so we decided to get in contact with the IPM to establish a collaboration.
Mike Wong (former post-doc in Reading, now a forecaster at the Hong Kong observatory) and I visited the IPM in spring 2017. We had a great time there with Yongren Chen, which was filled with scientific discussions, great food and some sightseeing (including pandas).
To generate the TPV yearbooks the researchers at the IPM use a network of sounding stations and manually identify TPVs and follow their paths using the wind field at 500 hPa and the geopotential height values from the radiosonde soundings which are available every 12 hours.
Yongren then came to Reading for two months in early summer 2017 and we started evaluating our database. From the yearbooks we selected ten TPV cases which moved off the TP and were related to heavy rainfall. We then looked through our database to find the matching cases in a gridded reanalysis of the recent past, called ERA-Interim. In a second step, we completed the comparison by selecting another ten cases from the ERA-Interim database of TPVs and matched them to cases from the yearbooks.

Figure 1: Researchers in the MESETA project and their visitors (top row: Senfeng Liu (IAP, Beijing), Yongren Chen (IPM, Chengdu), Mike (Kai Chi) Wong, Julia Curio; bottom row: Reinhard Schiemann, Andy Turner).
This comparison (Curio et al. 2018b) shows that there are cases where the two methods agree and cases where they disagree. The study revealed possible reasons for disagreement, which are differences in the data coverage, differences in the data, and differences in the methods.
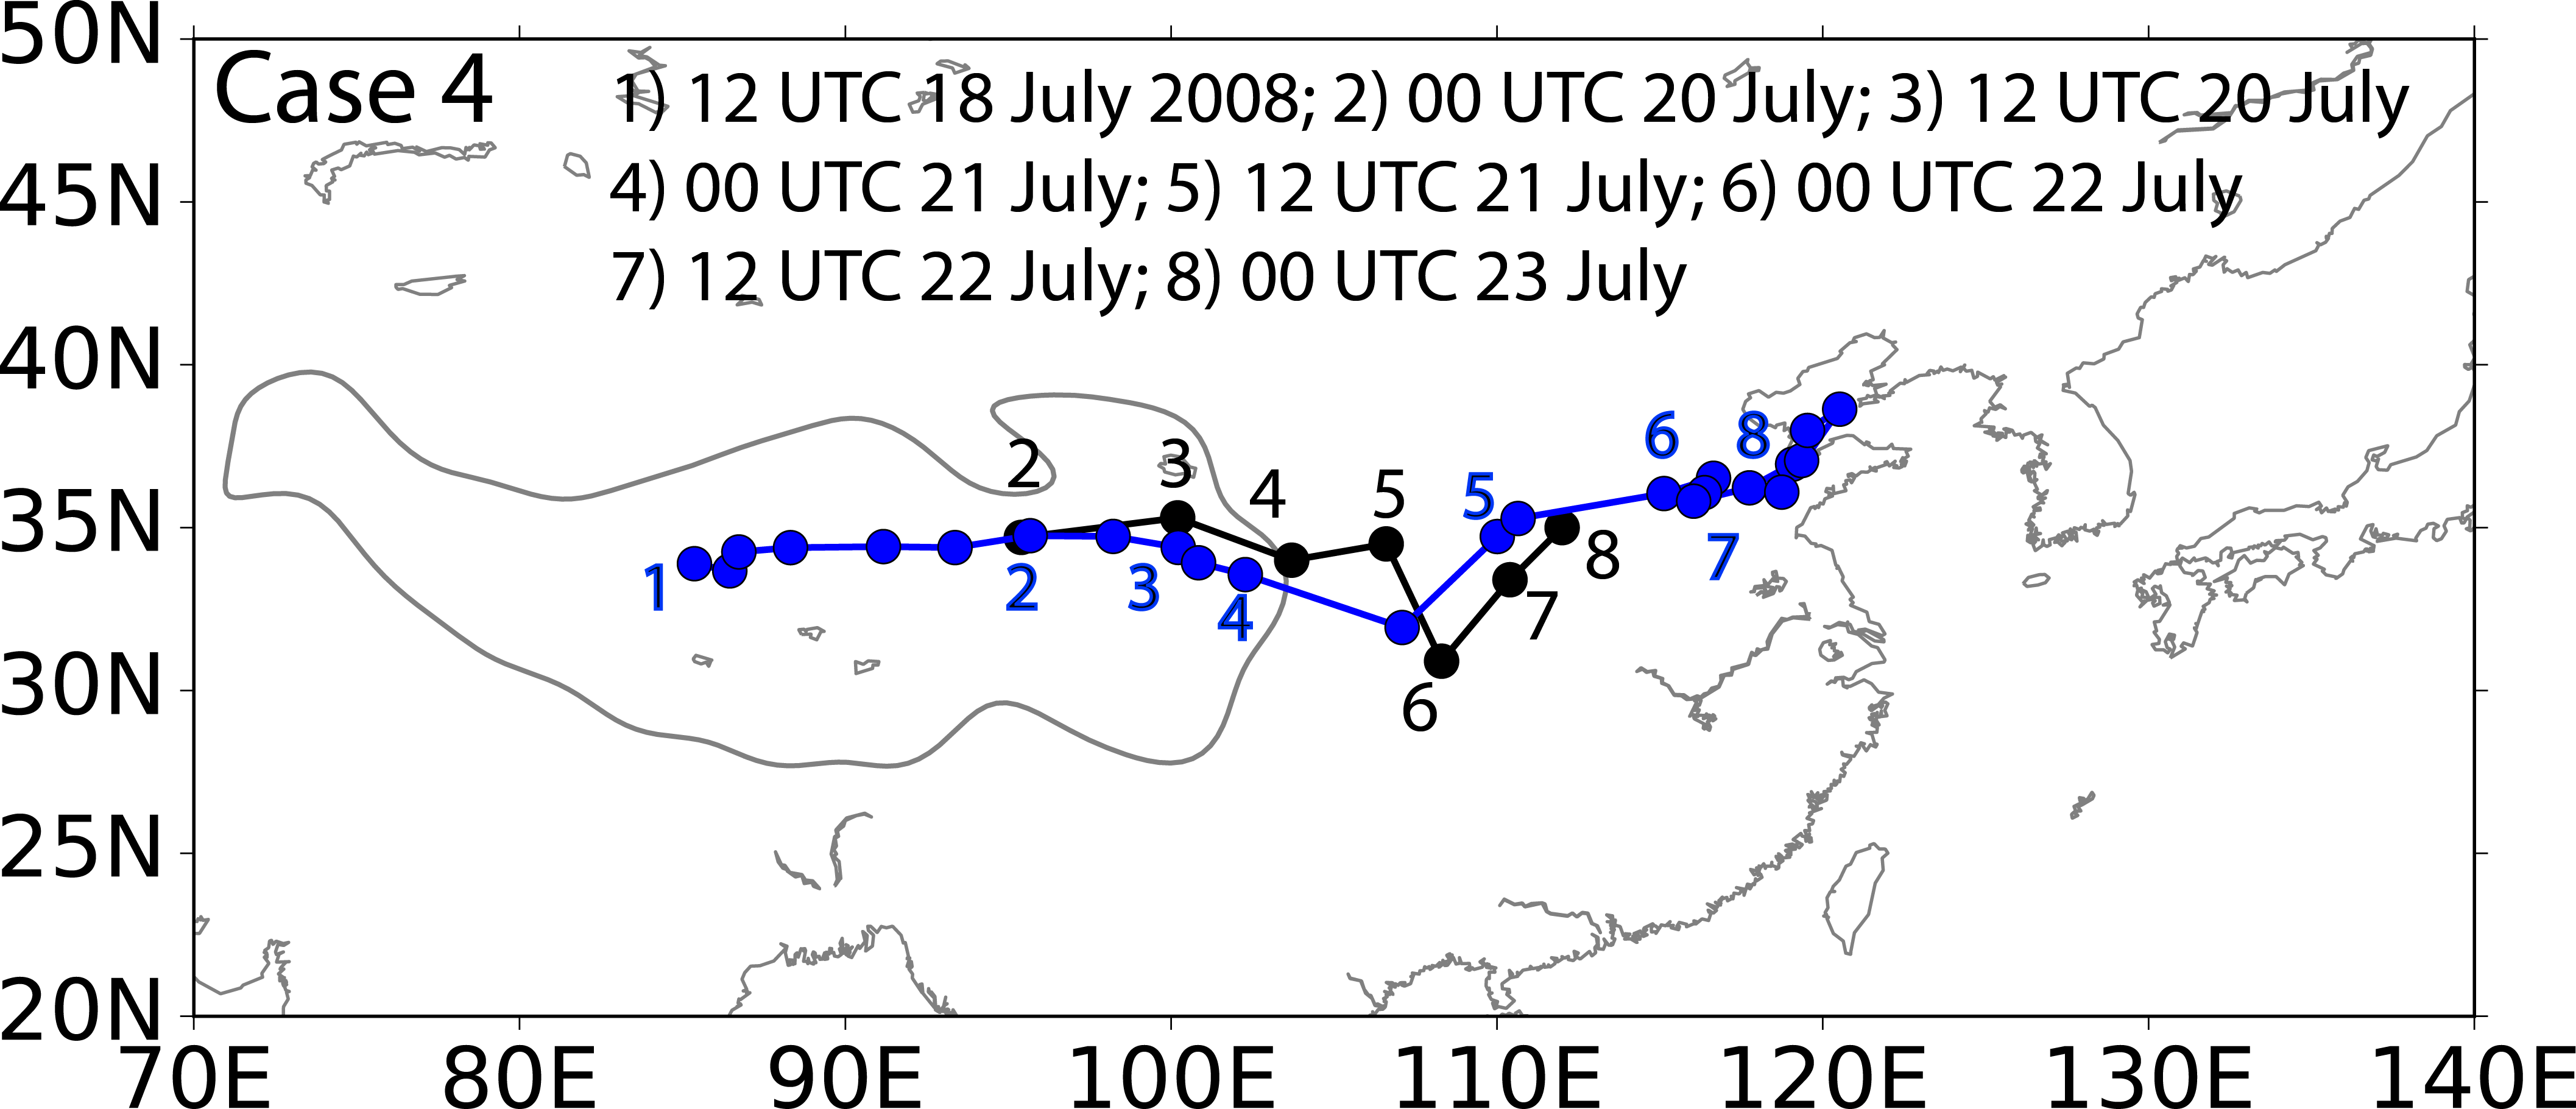
Figure 2: Path of a TPV selected from the TPV yearbook (black dots) and the matching TPV output from automated tracking using TRACK (blue dots).
We found cases where the automated method detects the systems much further west and therefore earlier during their lifetime (Figure 2), which is simply because the observational network (Figure 3) does not have any radiosonde stations in the western Tibetan Plateau where most of the systems are generated. This makes it difficult for the IPM to issue warnings in a timely manner since they only detect the TPV when they move east of 90°E.

Figure 3: Distribution of sounding stations (black dots) on the TP and its surroundings used for the manual TPV tracking. The colour shading shows the underlying orography.
The biggest advantage of the automated tracking of TPVs using a gridded dataset like ERA-Interim is the complete spatial coverage of the Tibetan Plateau and a relatively high temporal resolution of 6 hr, which leads to more reliable paths of the systems. The automated tracking is also objective and reproducible, while the manual tracking can lead to different results when performed by different forecasters.
Our colleagues at the IMP are interested in using the automated tracking to improve their forecasts, and thereby try to increase the lead-time for warnings of extreme rainfall events and subsequent flooding in the Sichuan province. We will continue our fruitful collaboration with the IPM and Yongren over the next years and try to implement the automated tracking of TPVs in the operational forecasting system used by the IPM.