By: Ed Hawkins
Over the past 12 months, thousands of volunteer ‘citizen scientists’ have been helping climate scientists rescue millions of lost weather observations. Why?

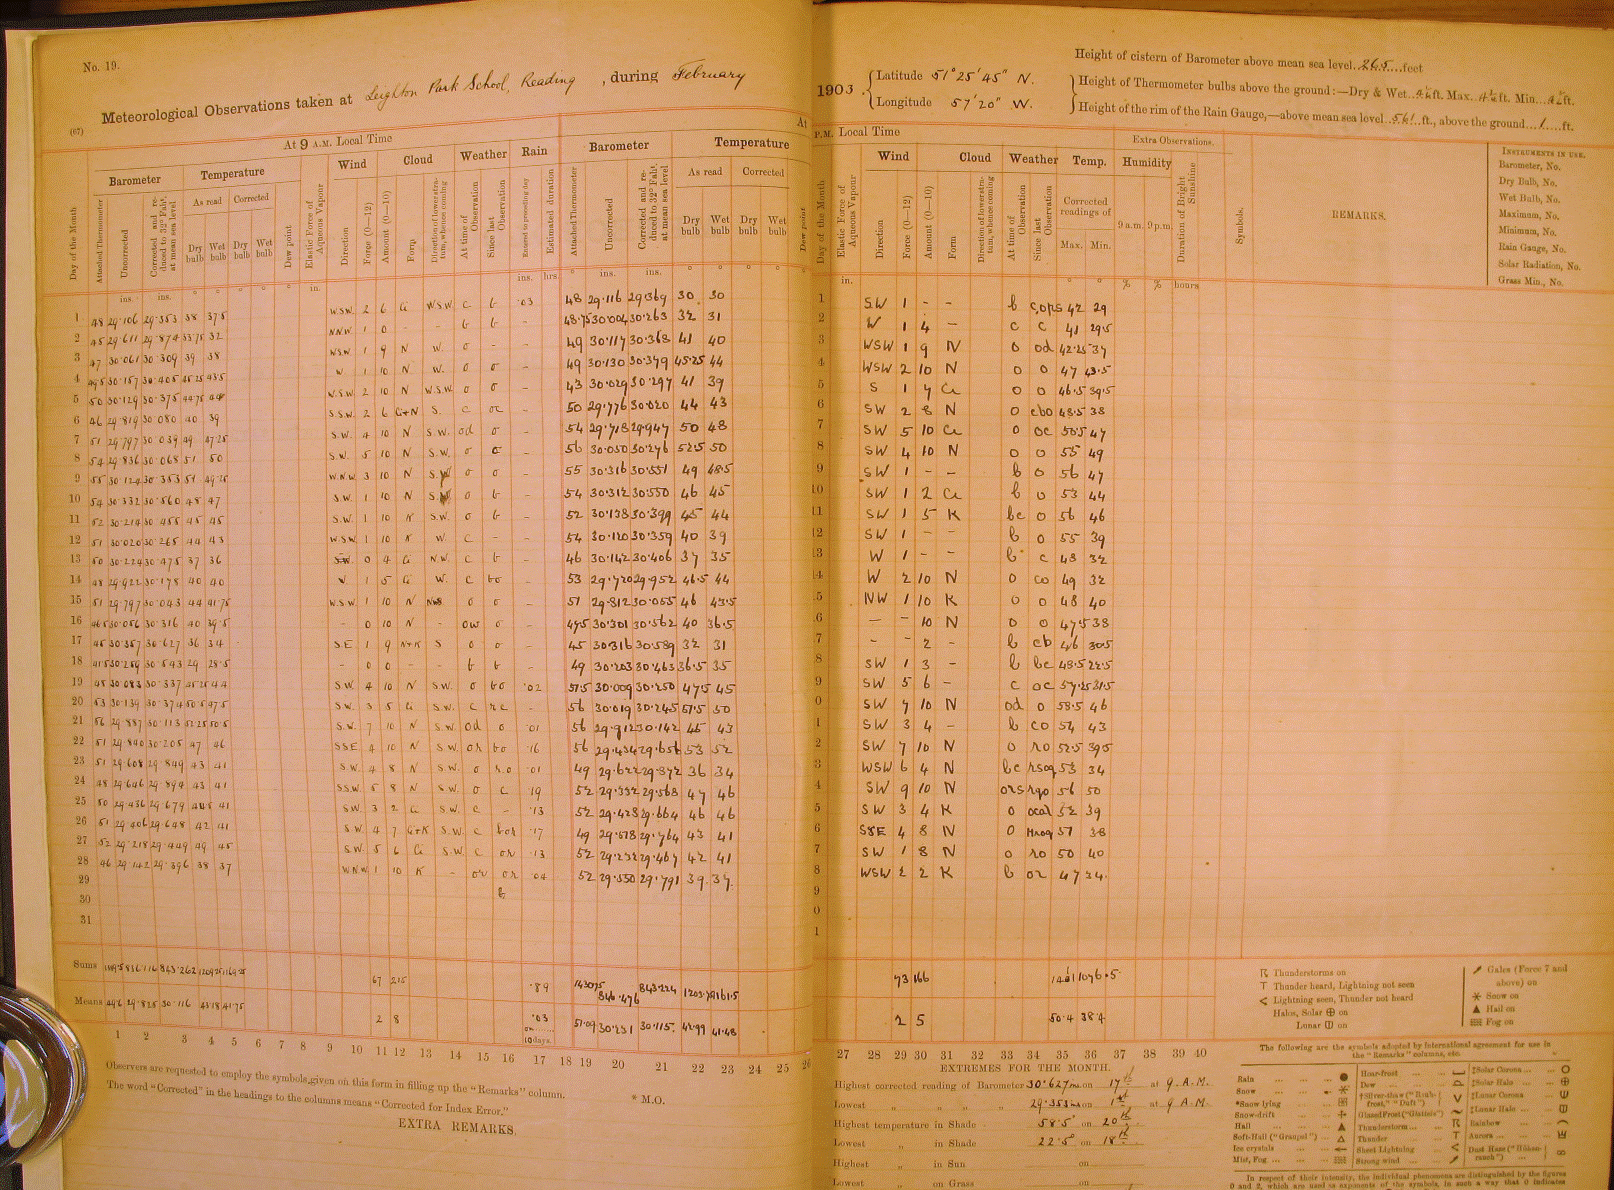
Figure 1: Data from Leighton Park School in Reading from February 1903.
If we are to inform decisions about adapting to a changing climate we need to better understand the risk from extreme weather events, and whether this risk is changing. This requires long and detailed records of the weather. In the UK we are fortunate that meteorologists have recorded the weather across the country for over 150 years. However, most of their observations are still only available as the original paper copies, stored in large archives (Figure 1).
Currently, the only way to transform these observations into useful data is to manually transcribe them from paper to computer. This is an enormous task and would be much easier if it was performed by thousands of people, rather than just a single PhD student.
The WeatherRescue.org website has been set up to enable anyone to help. The first phase of the project recovered 1.5 million observations that were taken on the summit of Ben Nevis and in the nearby town of Fort William between 1883 and 1904. The volunteers then transcribed 1.8 million observations from more than 50 locations across Europe taken between 1900 and 1910. They are now digitising observations taken in the 1860s and 1870s.
So, what can we do with all this data?

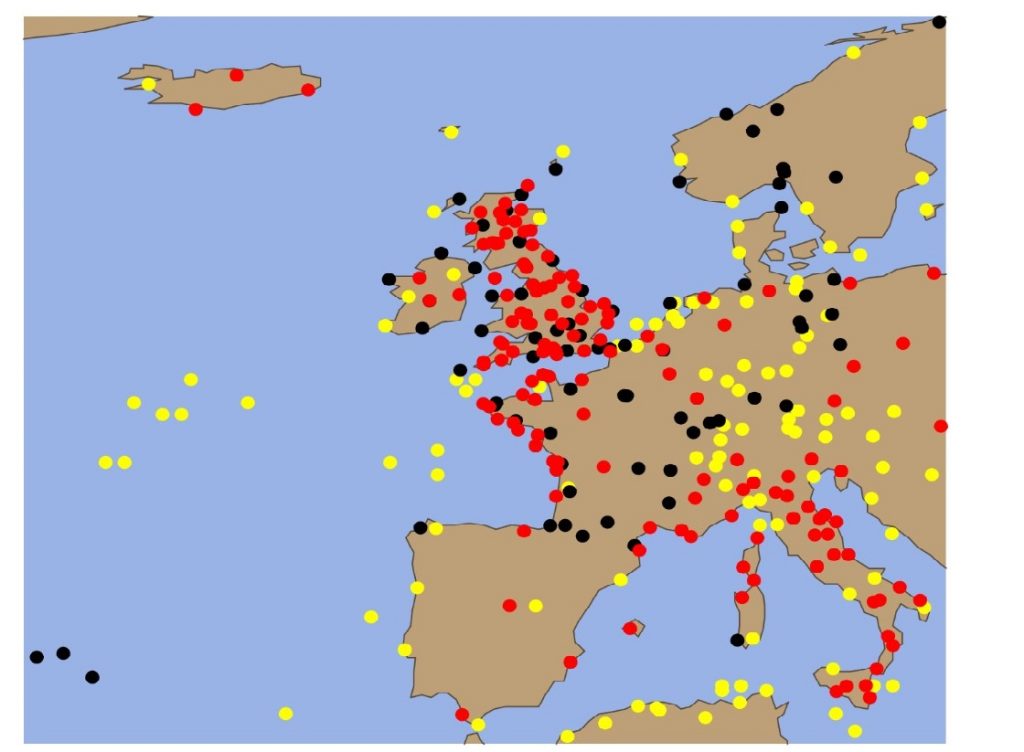
Figure 2: Map of pressure observations in the ISPD database for 27th February 1903, including from ships (yellow), with newly rescued data (black) and locations where we have images of the observation logbooks, but the data has not yet been digitised (red).
As a case study, there was a very intense storm on February 26th-27th 1903 which hit Ireland and northern England, uprooting thousands of trees, causing significant structural damage and several fatalities. Hundreds of pressure observations taken across the UK during this storm are not in our digital climate databases. Figure 2 shows the existing data (yellow), newly rescued data (black) and potential data still waiting to be rescued (red) for the period of the intense storm.

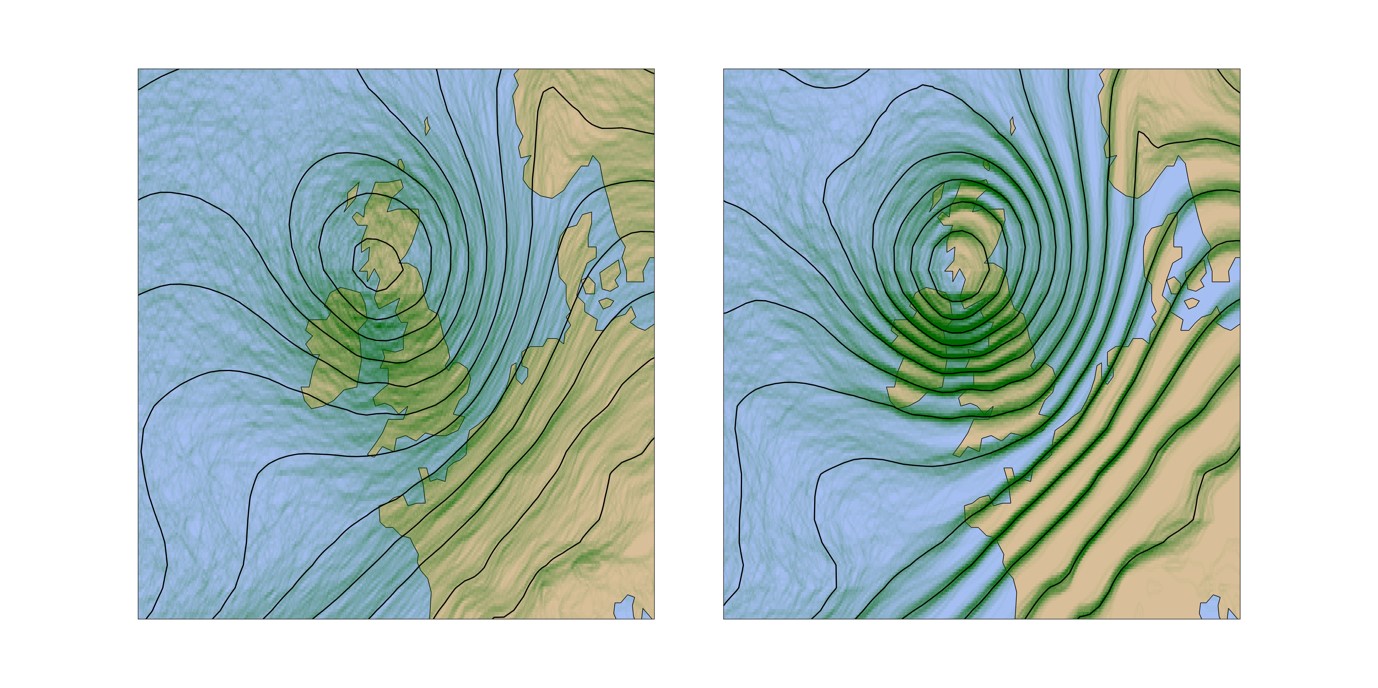
Figure 3: The 26th-27th February 1903 storm in the 20th Century Reanalysis (left) and an estimate of how it would look with the new observations (right). The black contours are isobars, and the green shading shows confidence in their position.
The new data allows us to better reconstruct the path and intensity of the storm. Figure 3 shows how the storm appears in the new 20th Century Reanalysis (left) – it is too weak to cause the damage that we know occurred, and the image appears fuzzy because there is much uncertainty about the storm’s location. The right-hand panel shows how the storm should appear with the newly rescued observations (black dots in figure above) – more intense and more certain, with strong winds over eastern Ireland and northern England where the damage occurred. The minimum central pressure is now simulated to be around 955mb.
Severe windstorms are relatively rare but cause significant damage. We need to learn as much about them as possible which means delving back into the past. Thousands of volunteers are helping us determine how the weather changed hour-by-hour over a century ago and to learn about such extreme events. Anyone can help at WeatherRescue.org.
