
This blog is my personal examination of the 43 year trends for rainfall on Whiteknights Campus, from 1968-2011 based on our local met station data. There have to my surprise been some interesting changes, contrary to the expected rainfall trends for the UK. These changes will be expressed over the next 10 graphs in the gallery. Graphs 1-4, highlight changes monthly across the whole data set, smoothed using the 5 year average, to highlight the underlying pattern. Key points:
- Rainfall is variable across every month, this is a result of local weather patterns such as thunderstorms, to global patterns such as La Nina /El Nino, changing jet stream location and storm patterns. Such events can also be random showing no pattern or seasonal/global with a regular pattern.
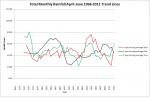
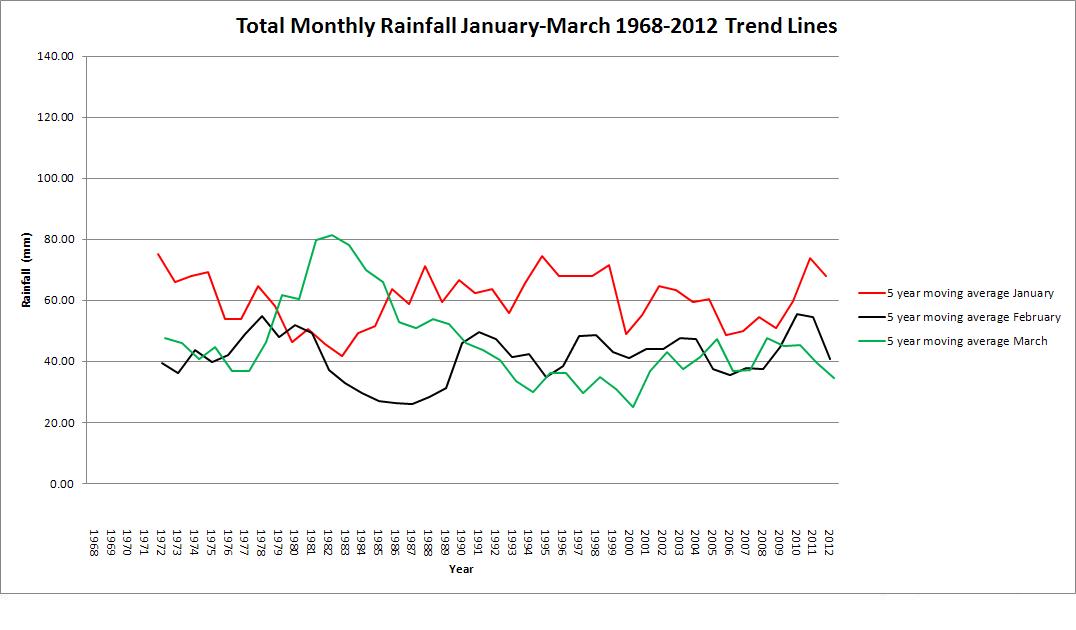
- The rainfall totals are steadiest over January-March graph 1, and as with all four graphs some of the greatest variation is within the 1980s, which also corresponds to the previous temperature blog, where there is a corresponding temperature drop. The steady rainfall pattern no doubt corresponds with jet stream movements and depressions being passed across the UK. There is also an indication that contrary to climate change theory for the UK, the rainfall across these months has been slowly decreasing over the last 20 years.
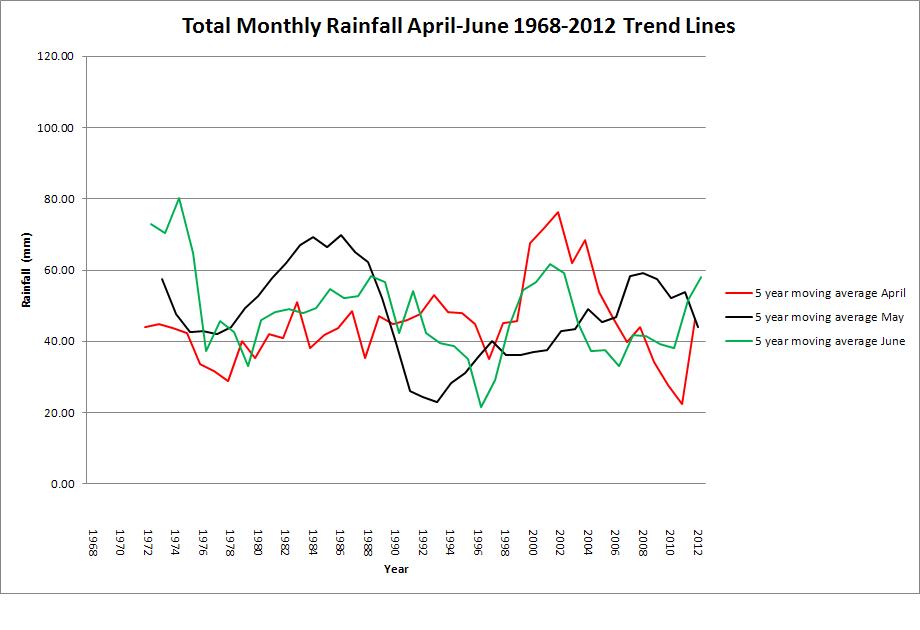
- Graph 2 indicates how erratic the rainfall can be in May and June, although, April is showing greater variability since the late 1980s, than at any time back to 1968.
- Graph 3 highlights a relatively steady pattern of rainfall in July and August although since the late 1990s, there has been a steep increase in rainfall over these months, whether this pattern will continue, plateau or drop we will have to wait until the end of the decade for a clear answer.
- September is showing the greatest variability in all of the 4 graphs and since 2000 rainfall totals have been dropping significantly.
- Graph 4 shows how October-December, as with January-March are effected by the jet stream and depressions from the Atlantic. Interestingly, the variation in rainfall is greater than January-March, this could be a result of stronger weather systems moving across the UK, both low and high pressure influenced by a warmer Atlantic Ocean or the continent. Another point is that again, contrary to climate change predictions since 2000, October-Decembers rainfall is showing a decrease. Whether this continues to below the general trend since 1968, we will have to wait for another few years!
-

- Graph 1 Total Monthly Rainfall January-March 1968-2012 Trend Lines
-
- Graph 2 Total Monthly Rainfall April-June 1968-2012 Trend Lines
-
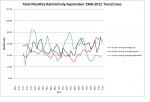
- Graph 3 Total Monthly Rainfall July-September 1968-2011 Trend Lines
-
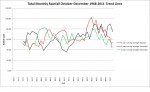
- Graph 4 Total Monthly Rainfall October-December 1968-2012 Trend Lines
-

- Graph 5 43 Year Monthly Average Rainfall with Error Bars
-
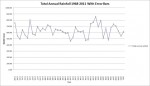
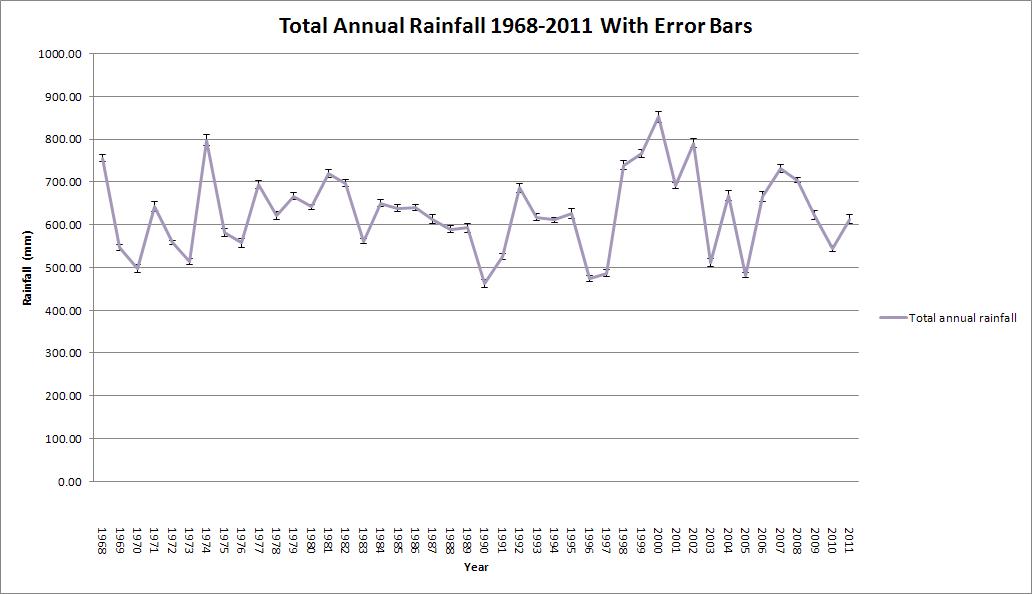
- Graph 6 Total Annual Rainfall with Error Bars 1968-2011
-

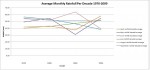
- Graph 7 Average Monthly Rainfall per Decade October-March 1970-2009
-
- Graph 8 Average Monthly Rainfall per Decade April-September 1970-2009
-

- Graph 9 Total Rainfall per Decade 1970-2009
-

- Graph 10 20 Year Average Rainfall 1971-2010
-


In general, as shown by graph 5, the 43 year average rainfall totals per month, only vary slightly over the year. February shows the lowest rainfall, which is likely to tie in with the fact February is also Whiteknights coldest month. October is the wettest month, probably explained as a result of strong weather systems passing across the UK.
In my opinion, the total annual rainfall graph 6, shows nothing of the trends, as total rainfall is effected by all 12 months of the year. Therefore, it is the monthly totals that would have the greatest impact on biological systems. The result is that rainfall totals could be high over the year but over the wrong months. Much like 2012 where we have seen drought effecting the beginning of the growing season, followed by extreme rainfall which also had the consequences of secondarily disrupting/changing biological systems i.e. delaying butterfly emergence and shortening their lifespan, effecting swifts ability to find insects but, also produced a spectacular display of UK orchids etc.
Graphs 7-8 highlight the decadal changes in rainfall totals across the 12 months. The data has been split between the warmer and cooler months. The images highlight the trends explained for images 1-4, but also the variation between decades.
Finally, graphs 9-10 highlight how overall, the 1990s was the driest decade since the universities records began and that even with the 1990s showing a decrease in rainfall, the 20 year average rainfall still shows that actually, rainfall has increased since 1971 all be it by just 18mm. Out of interest, in any one year, calculated from the 43 year average, Whiteknights Campus should receive around 628mm of rainfall a year.