 |
By Dr. Rob Thompson (University of Reading) 25th November 2016 |
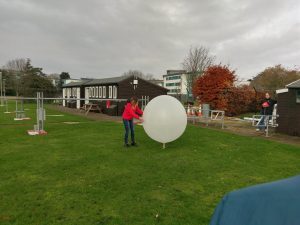
This week we held a conference for the FFIR programme, with meetings for projects SINATRA and FRANC and the kick off meeting for TENDERLY, all with lots of discussion. During the meeting, we took a short aside on Wednesday afternoon to launch a weather balloon and for me to give a tour of the University of Reading Atmospheric Observatory. The observatory is home to many instruments, a great deal of which have their data displayed live on the website linked above. While I gave the tour of the many instruments located at the observatory, and to discuss them would deserve a blog of it’s own, I’ll talk today about our radiosonde launch, and the fascinating profile it sent back.

First, what is a radiosonde? Well the radiosonde is actually the small box of instrumentation that is on the long string below the weather balloon. The “sonde” measures temperature, humidity, pressure and GPS (to tell us about the winds), they also have a port to add other sensors (such as ozone, turbulence and electrical charge). The package is sent into the atmosphere by helium balloon, they can reach as high as 40km, though this only only made it to 16.8km, still well into the stratosphere. We arrived as the balloon was nearly fully inflated, and ready for launch after just a few minutes, expertly done by our technicians, especially the experienced hands of Ian Read.

The walk over from the Meadow suite was rather nice, we were fortunate that is wasn’t particularly cold (about 9C), a bit of sun and not much wind… and interestingly, a selection of cloud levels, at least three were clear and I was suspicious that there were in fact 2 levels of lower cumulus clouds, though it was hard to tell by eye. The launch went off without a hitch and we could watch her ascend – Chris Skinner tweeted my favourite video.
https://twitter.com/cloudskinner/status/801419932600856577
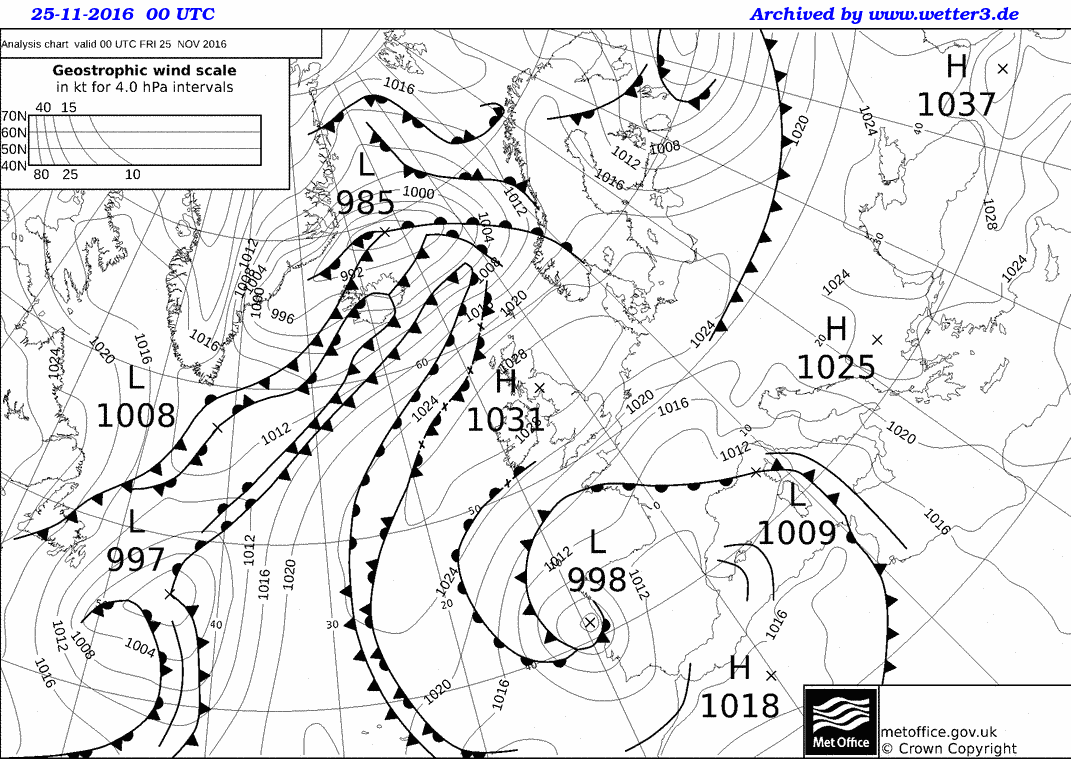
We watched the sonde for a few minutes and then began the tour of the observatory, before we got to observe the data coming in live, at this point we could already see the two (I was right!) low cumulus cloud layers and the very dry air from the anticyclone to the north of us, as seen in the synoptic chart.

Chart
We then returned to the Meadow Suite to continue the meeting, having had a break and some much needed fresh air. The poster session and programme advisory board overlapped, so while the posters were viewed I received the full data from Ian and could process the data and then hand draw the data in a tephigram. Tephigrams (T-phi gram, it’s a skewed graph of temperature against potential temperature) are an excellent way to present profiles through the atmosphere, they look horribly complicated, but with 2 lines on a 2d chart, a huge amount of information is delivered, and complicated maths can be done just by following lines on the plots… an amazing invention. I did some basic analysis and that’s what you see here.

So I was right, 4 layers of cloud, and a dry slot from the anticyclone that has descended to 800hPa from about 500hPa, becoming very dry (6% RH) from that descent. It really is a fascinating case, with 3 distinct temperature inversions and more apparent changes of air mass too. Just as a final plot, here’s the cloud radar vertical view from Chilbolton, it’s ~50km South-West of Reading, but had very similar conditions.

You can see here that there were high clouds during the morning that were descending and thinning, by 13:00, that cloud was just a thin layer and likely becoming patchy, but there are thin higher clouds at about 8km seen both earlier and later, likely what we saw as the high cirrus, that also appears on the ascent. Chilbolton seems not to have the low clouds Reading did, though they are present at 17:00, so perhaps that simply shows they were not overhead.
Overall, it was a fascinating time to launch the sonde and I had several people thank me for the tour and launch, I hope everyone enjoyed it and the change of scenery from the meting too.
