The Sun’s magnetic field varies on a range of timescales. Over hours and days, this leads to solar activity such as X-ray flares and coronal mass ejections (CMEs), which disturb the Earth’s space environment. This “space weather” waxes and wanes with an approximately 11-year “space season,” most apparent in the number of sunspots, but present in all forms of solar activity. Finally, there are much longer term changes in the solar magnetic field, on centennial and possibly even millennial times. It makes sense to refer to these timescales as “space climate.”
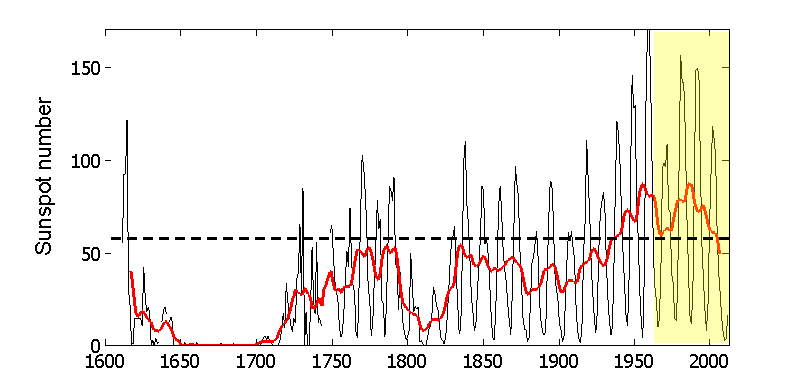
While sunspot records go back a few centuries and proxies for solar activity go back thousands of years, our experience with the solar magnetic field is largely based on the direct measurements only possible during the space age. The figure below shows sunspot number back to 1610: black is a monthly mean clearly showing the solar cycle, red is an 11-year running mean, which demonstrates the cycle-to-cycle variations. The space-age is shaded yellow: clearly, these observations have not been representative of typical conditions, with highly elevated sunspot numbers. The most recent data hint that the “grand solar maximum” of solar activity, which started around 1940, is drawing to a close. So you could say we’re in the midst of space climate change.
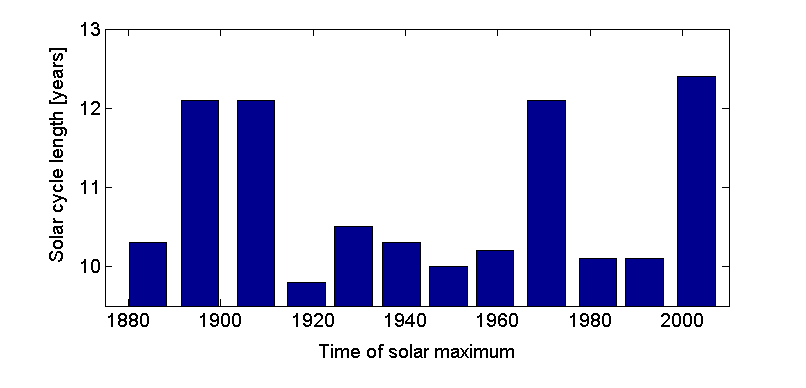
The last solar maximum, the seasonal peak of solar activity, was way back in 2000. What does the present/coming cycle hold and how will we know when the Sun’s reached a new solar maximum? Cycle-to-cycle variations in sunspot number mean a simple threshold cannot be used to define solar maximum. The figure below shows that assuming solar maximum will be 11-years from the previous one is also inadvisable – the previous cycle, from minimum to minimum, was almost 12.5 years long. The current cycle could be similarly protracted or be as short as 9 years. Thus sunspot number is only really useful for identifying solar maximum well after it has passed.
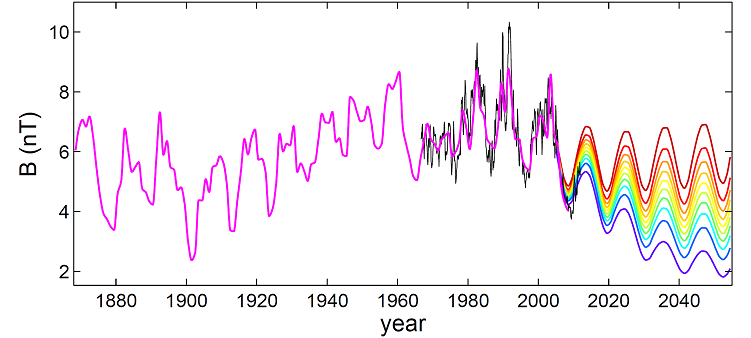
Spacecraft measurements of the solar wind in the near-Earth space also show strong solar cycle variations. However, much like sunspot number, using this data to identify solar maximum is complicated by the superposition of climate variations and solar cycle variations. The figure below shows the B, magnitude of the solar wind magnetic field in near-Earth space. Black is spacecraft observations, pink is a reconstruction based on geomagnetic data and the rainbow colours are a range of analogue forecasts based on past behaviour (which I won’t discuss in detail here). From the spacecraft observations, B has clearly been rising for a year or so, suggesting the new cycle is well underway. However, the current value has only just reached that of the previous minimum (1996) and there have been very few energetic CMEs or flares this cycle. So is the Sun still a few years away from a “normal” solar maximum, or is solar maximum nearly upon us, but this cycle is rather puny?
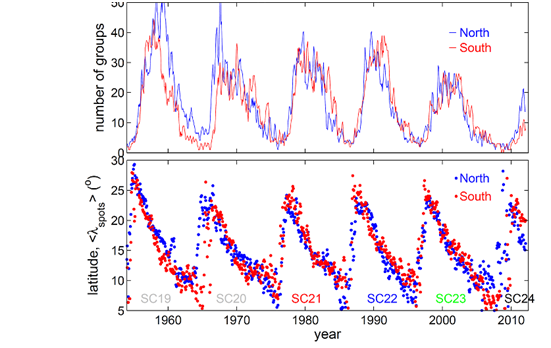
Well, us University of Reading folk (Mike Lockwood, Chris Davis, Luke Barnard, Simon Thomas and myself) are betting on the latter. Though we do have some insider information. The plot below shows the average latitude of sunspots in the north and south solar hemispheres. In the past, solar maximum has occurred when the sunspot latitude has reached ~17 degrees. Coupled with the declining strength of the Sun’s polar magnetic field (not shown), it appears solar maximum is on course for the end of 2012. That doesn’t leave much time for solar activity to pick up, suggesting clement space weather for the coming season. However, there are two caveats to this BBQ cycle. Firstly, while solar storms are expected to be less frequent, when they do occur they could be more extreme in magnitude (ask Luke Barnard about this). Secondly, the reduction in B will allow more galactic cosmic rays to reach Earth’s atmosphere, both posing a space-weather hazard and affecting the global electric circuit (ask Giles Harrison about this).
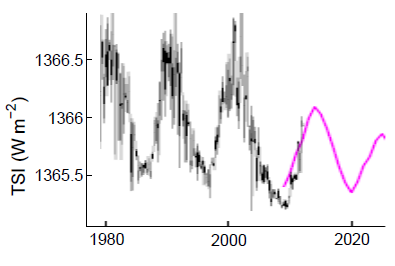
Also important for Earth’s atmosphere, a weak cycle will likely mean a reduction in solar irradiance. Below is a composite of the total solar irradiance (TSI) in black, with an analogue forecast in pink. This recent solar minimum resulted in the lowest TSI yet observed and it looks like the imminent solar maximum is set to result in a TSI about 0.5 Wm-2 below the previous space-age maxima. This wavelength-integrated change is small, but it could be far more drastic in the x-ray and UV portions of the solar spectrum, which would have effects for the ionosphere, thermosphere and even stratosphere. Furthermore, this could well be the start of a long-term decline.