The winter of 2012-13 definitely extended into late March (and, as I write this, into early April). Figure 1 (courtesy of Mike Stroud, our meteorological observer) sums up why it failed to feel like spring towards the end of the month.
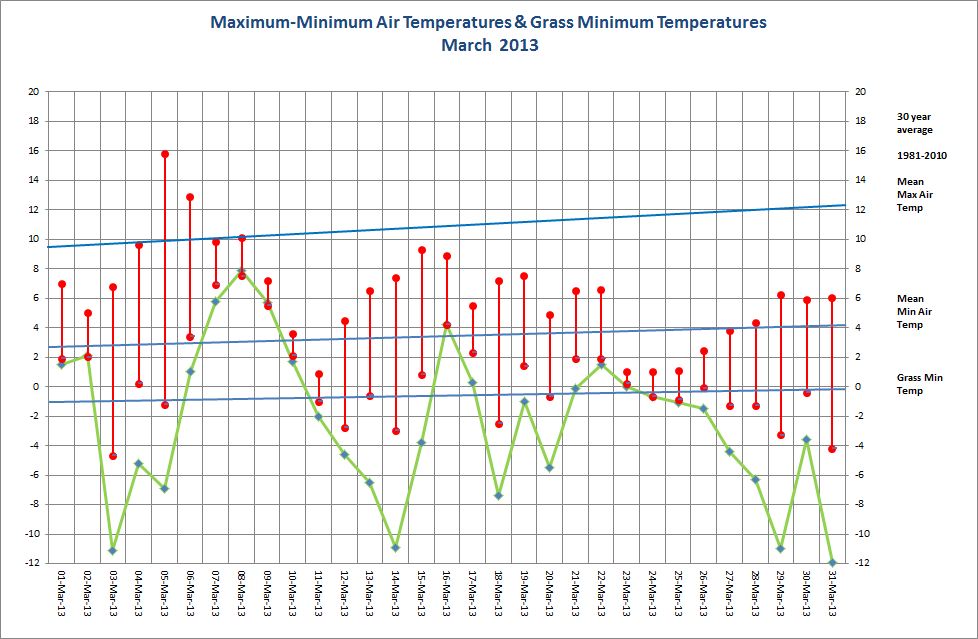
Shown in red are the daily values of the maximum and minimum air temperatures for each day, while the green points show the corresponding grass minimum temperatures. The latter are the readings used to define the occurrence of ‘ground frost’. Comparing the air temperatures with the climatological averages (the blue lines) it can be seen that just two days were warmer than average by day (in fact, the 5th might be described as being very warm for early March).
However, just six days after this very warm day (on the 11th) the maximum temperature in Reading rose to only 0.9C – the lowest such value in March since 1986 (when it remained below 0C all day on the 1st). [11th March 2013 was also the first of two days when the Channel Islands had one of their worst snowstorms on record, giving the greatest March snow depth at Guernsey Airport in their entire record (which goes back over 50 years).]
But things didn’t really get any better. Maximum temperatures in Reading on the 23rd (1.0C), 24th (1.0C) and 25th (1.1C) have never been this low in the 108-year station record in the final 11 days of March – and to have three consecutive days with such low values at this time of year is truly remarkable. Fortunately Reading missed out on the severe snowstorms that affected areas of N England and Scotland around this time – but we still had 11 days with snow or sleet falling during the month, a March total equalled (since 1908) only in March 1937.
With March (and Easter at the month’s end) being a time when gardeners like myself start trying to prepare their vegetable beds for spring sowing, the frequency (and severity) of ground frosts during the month was of no help at all. Four nights dipped below -10C at grass tip level (two of those being in the final three days of the month) – not since 1985 have there been four ground frosts this sharp in March. These cold nights along with a wet soil – March was another wet month in the 12-month spell of weather that began in April 2012 – and a lack of warmth by day led to cold soil conditions. At 0900 GMT on 31st March 2013 the soil temperatures (and their anomalies with respect to the 1981-2010 average value for that date) were as follows:
- 5 cm depth: 0.0C (anomaly -7.7 degC)
- 10 cm depth: 0.7C (-6.5 degC)
- 20 cm depth: 2.1C (-5.5 degC)
- 30 cm depth: 4.2C (-3.9 degC)
- 50 cm depth: 4.6C (-3.0 degC)
- 100 cm depth: 5.5C (-2.4 degC)
Such temperatures are ones that are more typical of a cold spell in mid-winter!
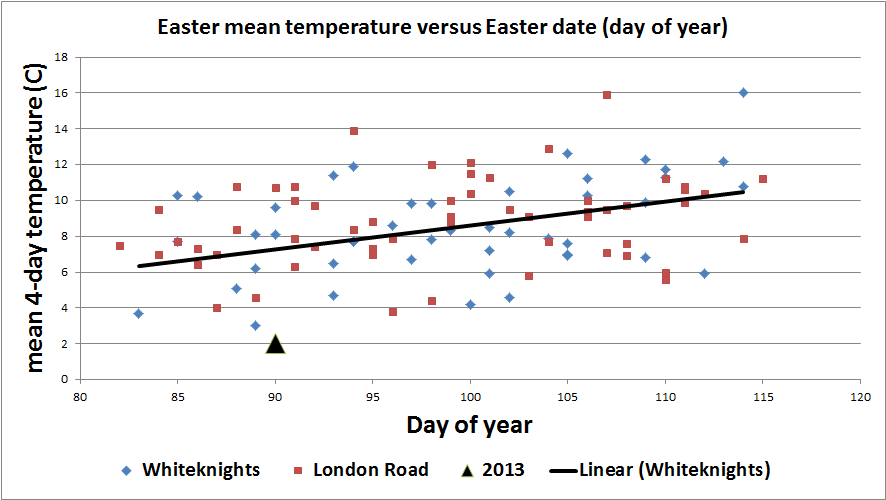
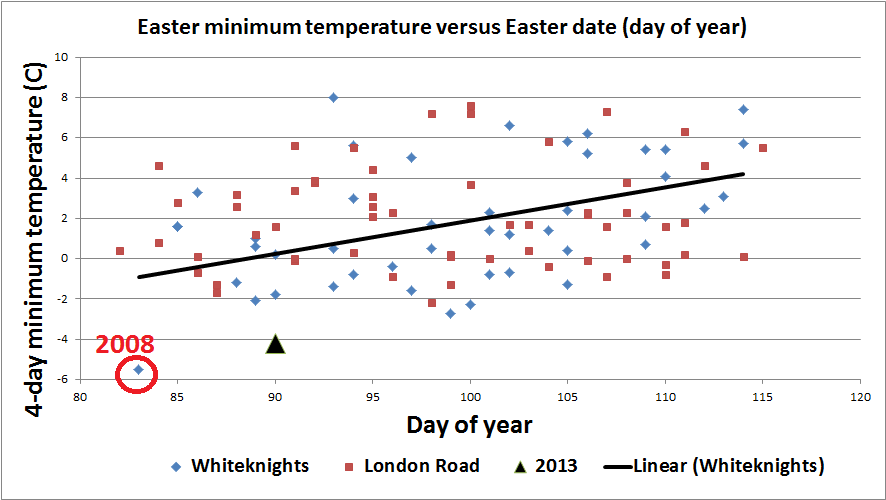
Even allowing for the fact that Easter was quite early this year, air temperatures were remarkably low over the four-day period (Friday-Monday) as shown in figures 2 and 3. In these figures the black triangle denotes the value for 2013 with data plotted against the day number of the year representing Easter Sunday.
Overall during March the average daily maximum temperature in the air was 4.5 degC below average while the night minimum temperature was 3.1 degC below average. The month as a whole was the coldest March since 1962 – and since 1908 only March 1917 has also been colder (once allowance is made for the fact that readings before 1968 were made at the London Road campus – a slightly warmer site).
More remarkable is the fact that the average maximum temperature for March 2013 was the lowest for March since Reading’s observations began in 1908. Local records from nearby sites (S Burt, pers. comm.) suggest that we need to go back to before 1871 to find a lower March mean maximum temperature.
Why was it so cold – figure 4 suggests a rather unusual flow from an easterly direction during the month…
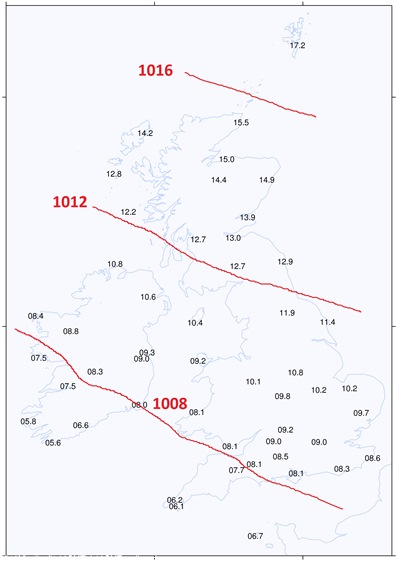
…and this flow was persistent as shown by the winds observed by the Reading automatic weather station (observations every 5 minutes) in figure 5.

With such a persistent flow from the east the cold can be understood – especially as Scandinavia and N Europe were at times 8 degC colder than average during March. The fact that March was a dull month – the dullest since 2001 – is also understandable. But it was also a wet one – fronts often tended to bring precipitation from a southerly direction while the winds blew from the east around low pressure to the south. This pressure distribution was put down to the jet stream taking a more southerly track through Europe during the month.
The end of March marked the 12th month since the dramatic change to wet weather in April 2012. These 12 months have given Reading 913.9 mm of precipitation – or 44 per cent more precipitation than average.