A brief overview
After a dry start to December 2013 (just 11.3 mm of rain fell in the 33 days ending 0900 UTC on 15 December at the Department’s weather station) there was an abrupt change in the weather that was to last for over three weeks.
Many others have, over recent days, written and spoken about the reasons behind this wet and stormy period of weather in the UK. Here, I shall present some local statistics and try to place the event into an historical perspective.
Wind and pressure
Numerous deep depressions, guided towards the UK by an unusually vigorous jet stream, were to bring frequent gales and heavy rainfall to many parts of the British Isles, most notably to southern and western areas, from mid-December to early January.
In Reading peak wind gusts recorded during the period 0000-2400 UTC included the following
23 December: 52 knots, 24 December: 66 knots, 27 December: 45 knots,
30 December: 40 knots, 3 January: 45 knots.
The gust on the 24th was the strongest gust in Reading since February 1990 when 71 knots was measured. The highest gusts in the Reading wind record remain those of 76 knots on 25 January 1990 (the Burn’s Day storm) and 75 knots on 2 January 1976. Gust records date back to 1961 in Reading (although there is a gap in the record during the period August 1971 to May 1974).
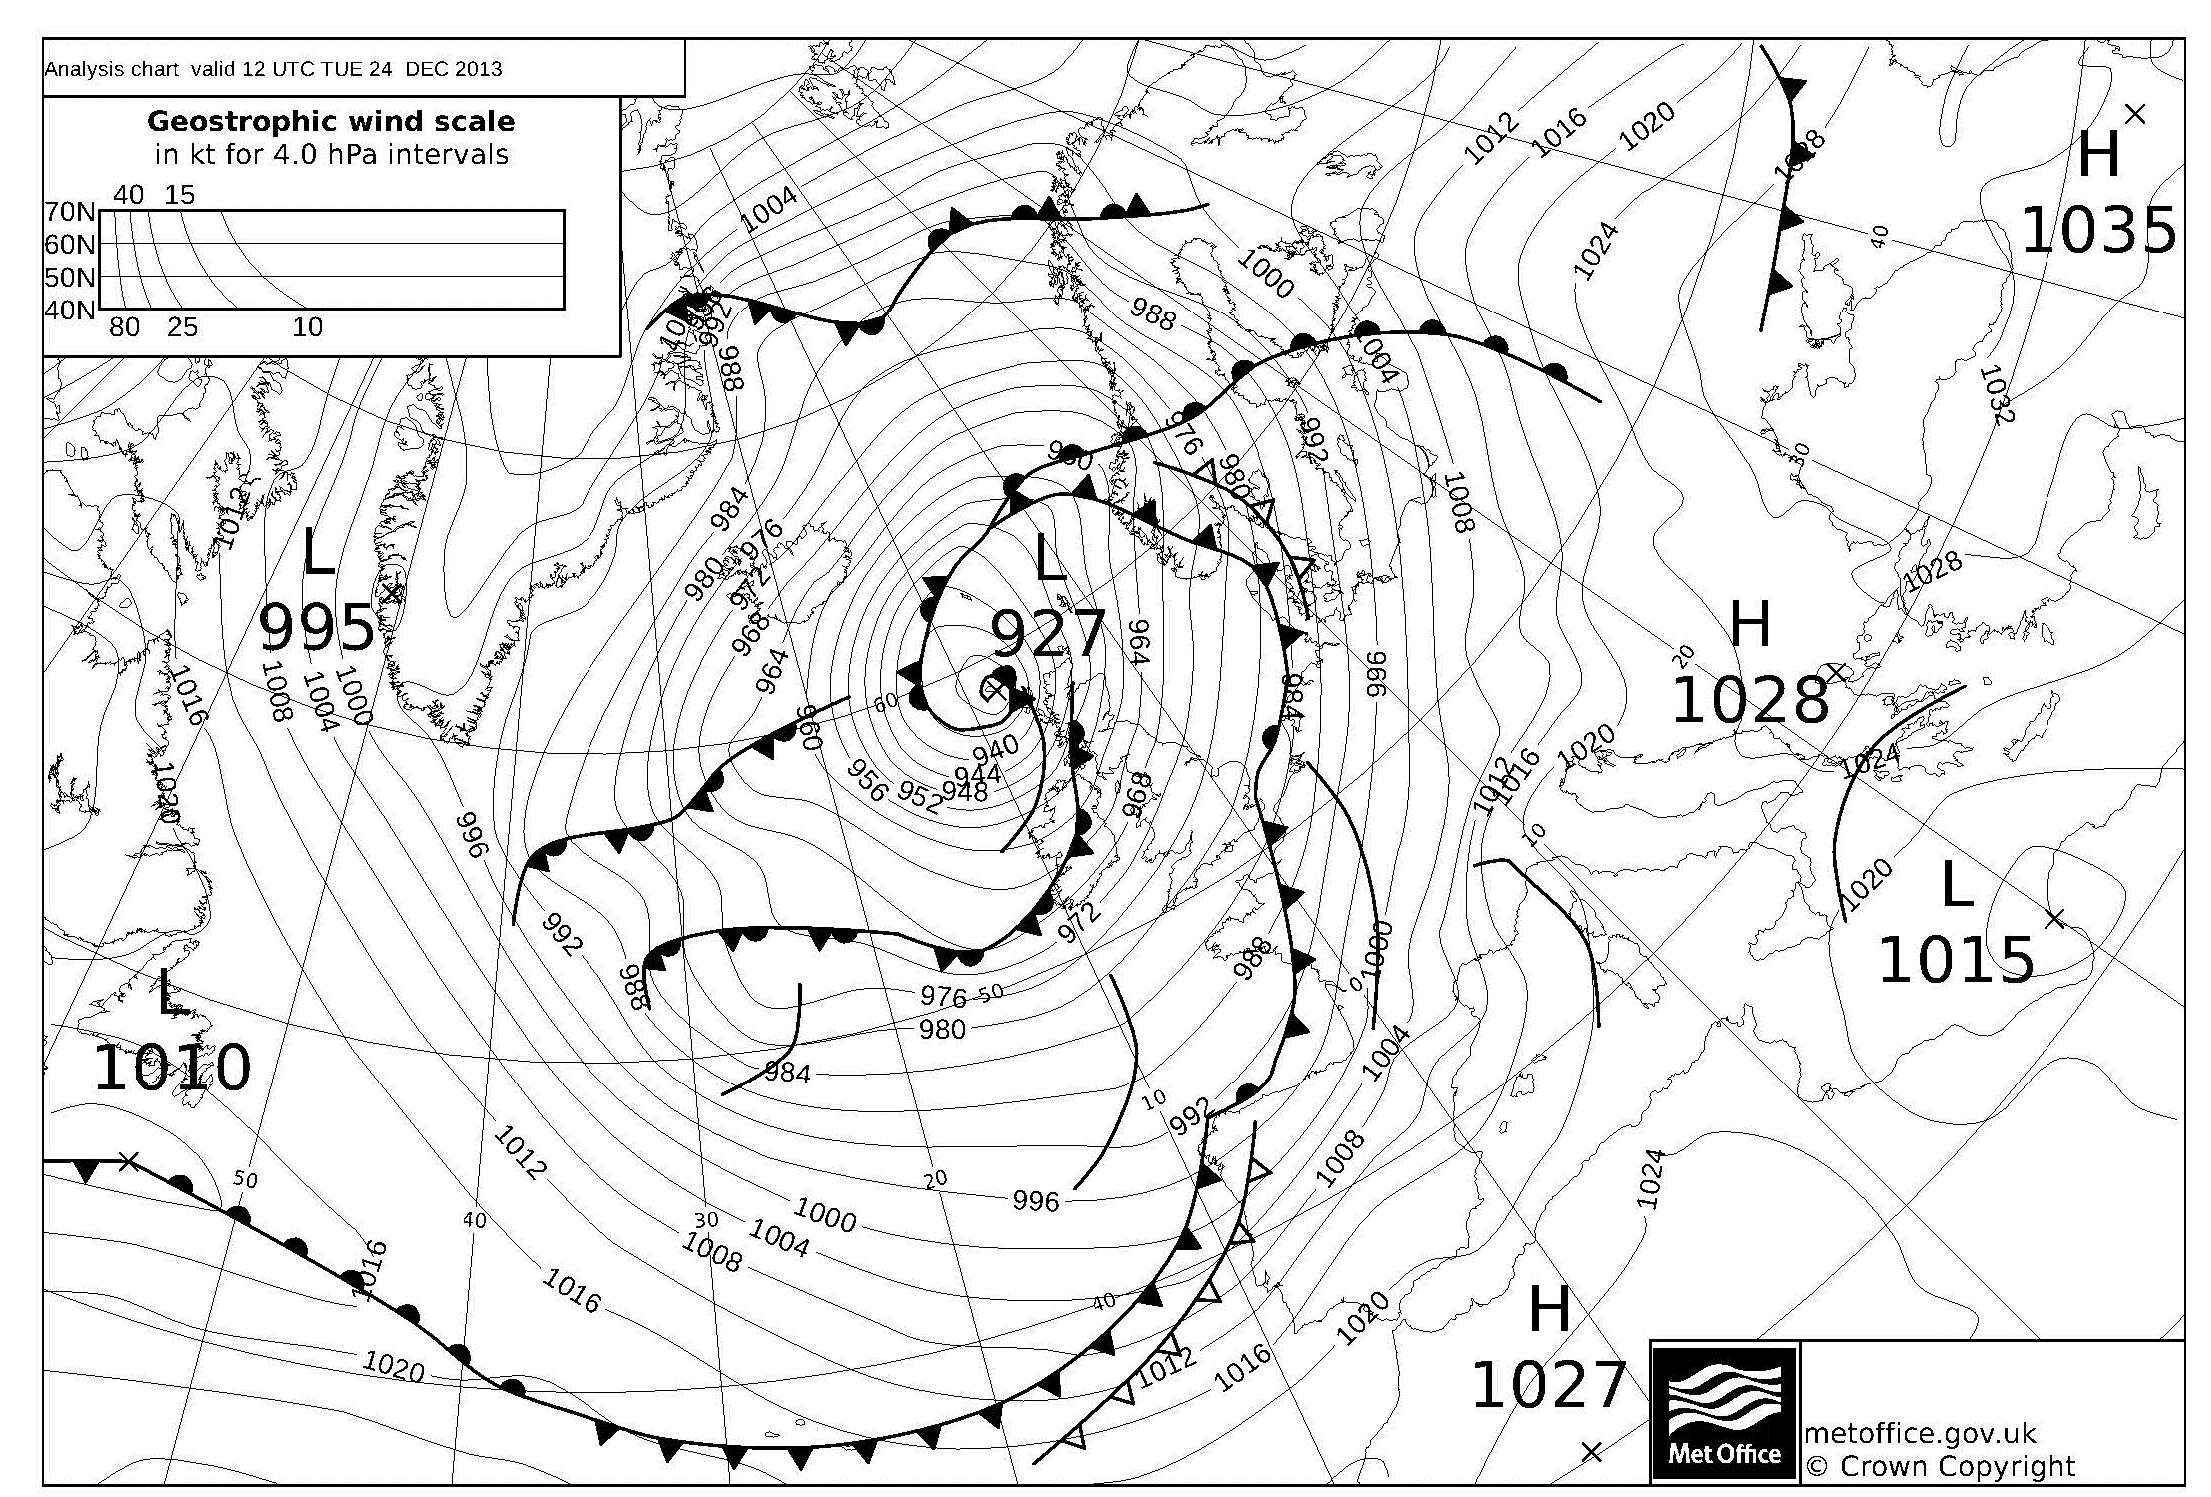
The conditions In Reading on 24th December were due to an exceptionally deep depression centred to the west of the British Isles. The analysed central pressure at 1200 UTC was 927 mb to the northwest of the Hebrides; the mean sea level pressure of 936.4 mb recorded at Stornoway Airport at 1229 GMT was the lowest over any land in the British Isles for any month since 1886 (see Burt SD. 1983. New UK 20th century low pressure extreme. Weather, 38: pp 208–213 and Burt SD. 1983. The lowest of the Lows … Extremes of barometric pressure in the British Isles, Part 1 – the deepest depressions. Weather, 62: pp 4-14).
The winds overnight 23rd-24th December did cause some local damage – primarily downed roof tiles and some trees, but also other building damage in central Reading, e.g. ‘The Blade’ building.
In Reading over the Christmas-New Year period MSL pressure fell to the following low values as depressions passed close by:
24 December 973.3 mb
27 December 981.0 mb
1 January 982.5 mb
On the 24th, the contrast between the minimum in Reading and that mentioned at Stornoway Airport is remarkable and explains the wind strengths observed across the British Isles on the 23rd-24th.
With weather systems bringing our weather from a mild direction (the west), average temperatures during this stormy period were about 2 degC above average in Reading.
Rainfall
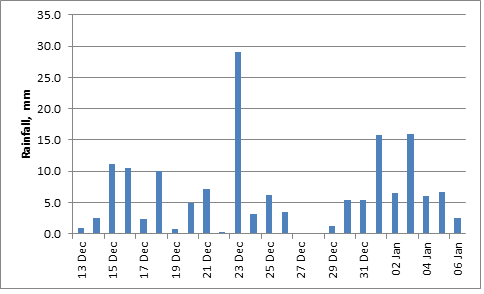
But being an inland site, winds in Reading are necessarily less than those reported in coastal locations – even along the English Channel just to the south during this period. Rainfall was the main feature of the weather in Reading; persistent falls over a short period were to have a major impact on travel in and around Berkshire (and, indeed, in many other parts of the British Isles) from about 23rd December onwards.
The fall of 29 mm on the 23rd was the greatest 24-hour fall in December since 19th December 1995 and only 1989 (35.8 mm), 1954 (43.2 mm) and 1919 (33.5 mm) have had a wetter December day at the University since 1908.
Around Reading, due to the dry conditions earlier in the month, the main disruption did not occur until after Christmas as the ground was still, relatively, dry. However, just a short distance to the south and south-east falls of 40-75 mm fell in parts of Hampshire, Surrey and Kent on the 23rd-24th, resulting in rivers bursting their banks and consequently a power loss at Gatwick Airport (for example).
In the 22-day period 15th December to 5th January a total of 152.3 mm of rain fell at the University. Climatological averages of rainfall in Reading during 1981-2010 are 63.0 mm in December and 60.4 mm in January, with the annually-average total amounting to 634.6 mm.
While the total rainfall in December 2013 (106.0 mm) was less than in December 2012, the 22-day total was the greatest such fall since October-November 2000 when 157 mm fell in a 22-day period. Indeed, by the 7th January the fall during the (26-day) wet spell had reached the equivalent of a quarter of the annual average rainfall total in Reading.
Looking back over the records, we find there have been seven such wet periods:
- November-December 1929 when 178 mm was the greatest 22-day rainfall total. This spell included the second wettest November on record. By the end of the November the Thames was approaching a state of flood and it duly burst through its banks in several places. 164 mm fell in an 18-day period and not until mid-December did it turn dry in Reading for a few days. Seven days recorded in excess of 10 mm of rain in Reading.
- October-November 1940 (171 mm in 22 days). November 1940 was another wet November although the final week was a dry one. A fall of 30.2 mm on 13th November was one of the wettest November days on record at the University.
- October 1949 (154 mm in 22 days). There were many dry days in this spell –three-quarters of the rain fell on five separate days allowing for some drying out in between events.
- October-November 1951 (162 mm in 22 days). A four-week wet spell from the final four days of October onwards led to the wettest November on record in Reading with by far the wettest November day on record – a fall of 38.4 mm.
- June 1971 (155 mm in 22 days). This was an unusual summer wet spell. June 1971 was a cool and wet month – the only June on record to surpass a total of 150 mm. However, no measurable rain fell during the first week, nor between the 20th and 24th; 10 mm or more fell on four days with 54.7 mm falling on the 10th during a spell of almost 21 hours of rain that day. Some flooding occurred around Reading as a result of this wet spell.
- October-November 2000 (157 mm in 22 days). Much of this fell in a 10-day spell beginning on 28th October. Flooding along the Thames was relatively minor compared to some past events – but further heavy rain on several days in December caused more flooding by mid-December.
- December 2013-January 2014 (152 mm in 22 days). This led to river flooding in places around Reading into early January in particular.
Note that the statistics presented in these seven notes above all refer to the University of Reading weather station.
Flooding
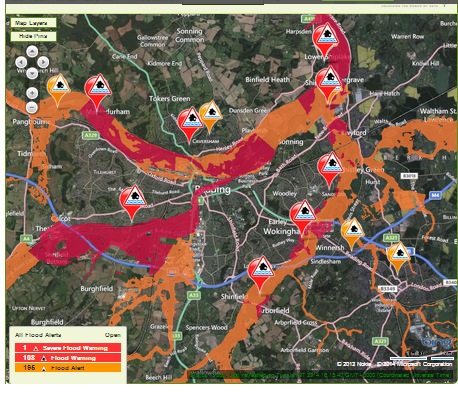
The figure above shows the extent of flood warnings in the Reading area, as of 1621 UTC on 7th January 2014. The image is from the website of the Environment Agency, http://www.environment-agency.gov.uk/homeandleisure/floods/142151.aspx. Flood alerts are shown in orange and flood warnings in red.
Although there were small pockets of flooding to the south of Reading as a result of the rainfall on the 23rd December, due to the dry spell of late November-early December for many in the Reading area flooding did not occur until the ground became progressively saturated after Christmas and into 2014. This led to large amounts of runoff into the rivers passing through the town, causing some travel disruption on the roads and railways – in particular once the Sonning Bridge was closed, restricting traffic flow across the River Thames.
Written: 7th January 2014