Gardeners among the readership of this blog may already be watering their seeds in an attempt to ensure germination and early growth, and may be wondering how common this activity is (over the years) given the fact that spring is only halfway sprung and the past winter was not that dry overall.
One observation carried out each morning in the Reading University Atmosphere Observatory is that of determining the ‘state of the ground’, the observations being represented by one of 20 integer codes. Some of these observations are made using a weeded, plot of bare soil in the Observatory enclosure.
Thus, as well as determining whether the ground is snow-covered, the duty observer will, in the absence of any snow or ice cover, decide whether the bare soil patch can be described a dry, moist, wet, flooded or cracked, for example. The World Meteorological Organization specifies 10 code figures for such descriptions – see Table 1. A similar table of codes exist to describe conditions when there is ice or snow on the ground – the observer uses one, but not both codes – on any given day.
Table 1. Codes use to specify the state of the ground when no ice or snow is lying (WMO code 0901 on page A-274 of https://drive.google.com/file/d/0BwdvoC9AeWjUOFdkaXlCUUpETmM/view). These codes have been in use at the University since January 1982.
| Code | Description |
| 0 | Surface of ground dry (without cracks and no appreciable amount of dust or loose sand) |
| 1 | Surface of ground moist |
| 2 | Surface of ground wet (standing water in small or large pools on surface) |
| 3 | Flooded |
| 4 | Surface of ground frozen |
| 5 | Glaze on ground |
| 6 | Loose dry dust or sand not covering ground completely |
| 7 | Thin cover of loose dry dust or sand covering ground completely |
| 8 | Moderate or thick cover of loose dry dust or sand covering ground completely |
| 9 | Extremely dry with cracks |
Recently (as of 20 April 2015) the Reading observations indicate 8 consecutive mornings with the ground being ‘extremely dry with cracks’ (there had also been 2 similar observations earlier in the month. No doubt this total has been helped by a fall of just 6.3 mm of rain so far in April 2015 – well below the average of 48 mm expected for the month.
Of course, soils vary and the response of a particular soil to the effects of wind/rain/sunshine/air humidity and temperature will depend upon the mineral and organic matter composition of the soil (gardeners will be well-aware of the benefits of an organic mulch, for example, and of the way that clay-rich soils tend to be heavy and retain moisture).
Clay soils are also more prone to cracking than are soils with a fine tilth. The clay particles act just like a sponge – they swell as they soak up water, and then they shrink as they dry out. In a spell of dry weather, the shrinkage can result in large cracks. In severe cases, these soils can undermine the foundations of buildings because they swell and shrink so much. Such conditions were widely reported during the dry spell of 1975-1976 in parts of the UK. In Reading during April-July 1976 (a different set of codes was in use then) 106 of the 122 days were reported as having ‘dry’ soil and only 16 were classified as ‘moist’. During 1982-2010 the number of days with moist soil was almost exactly the same as the count of dry or cracked soils during these four months on average – largely thanks to April 2007 (see Figure 1 below) when less than 1 mm of rain fell all month.
So how do the ’10 soil cracked days’ of 2015 compare with measurements made in April over the years? The answers are in Table 2.
Table 2. Averages of daily count of measurements of the state of the bare soil patch (1982-2010) when snow/ice-free, and the maximum count of given conditions in a single calendar month (1982-2014). These are compared to the observations of 1-20 April 2015.
| Code | Average occurrence in April, 1982-2010 | Greatest number of occurrences in April, 1982-2014 | 1-20 April 2015 total |
| 0 | 8.0 | 21 | 3 |
| 1 | 19.5 | 30 | 6 |
| 2 | 0.2 | 3 | 1 |
| 3 | 0 | 0 | 0 |
| 4 | 0 | 1 | 0 |
| 5, 6, 7, 8 | 0 | 0 | 0 |
| 9 | 2.1 | 14 | 10 |
| Mornings with snow/ice cover | 0.2 | 2 | 0 |
Table 2 shows that a cracked ground is reported in April on about two days each April on average. In fact, April tends to account for about half the annual count of cracked soils in Reading on average during 1981-2010.
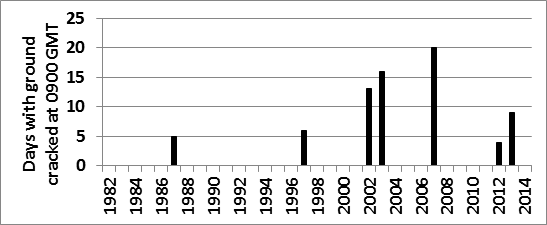
As with many on/off types of meteorological observations, the complete observational database indicates quite a variation in this count, however (Figure 1). Just 7 out of the 33 years had soil this dry, with only 5 of those having cracked soil on 5 mornings or more. Maybe there is a suggestion of an increased frequency of such events since 2002 – gardeners beware!