
By John Methven
Weather systems developing over the North Atlantic and hitting Europe are intimately related to large-amplitude meanders of the jet stream, known as Rossby waves. Characteristic weather patterns grow in concert with the waves, and the jet stream acts as a wave guide, determining the focus of the wave activity at tropopause level (about 10 km altitude). Rossby wave energy transfers downstream rapidly, amplifying troughs and ridges (read on to find out what these terms mean). When Rossby wave propagation stalls we can experience persistent weather, like the exceptionally wet summer of 2007 or cold winter of 2009-10. In contrast, the 2013-14 winter saw a succession of cyclones following the jet stream into the UK and was the wettest on record, resulting in flooding nationwide. In their 2014 report, the Department for Communities and Local Government estimated that the total insurance claims bill for households and businesses flooded was £427 M. In addition, the Government committed £560 M to help communities and businesses recover and to repair the damage to roads, railways and flood defences. There is no doubt that Rossby waves and their downstream development across the Atlantic are a major influence on the UK economy.
Recent research has shown that ‘forecast busts’ (where skill is much lower than usual) for Europe share a common precursor 5-6 days beforehand; there is a distinct Rossby wave pattern with a more prominent ridge (northwards displacement of the jet stream) across the eastern USA. The reasons for these forecast busts are not known, but it is hypothesised that the representation of diabatic (cloud and radiative heating) processes, over the USA and Atlantic, lowers the predictability in this situation. Diabatic processes create shallow temperature structures either side of the tropopause, tending to enhance tropopause sharpness and the jet stream wind maximum. Recent theory indicates that tropopause sharpness can have a far-reaching influence on Rossby wave propagation and thereby downstream forecast error. However, the sharpness is not well represented in both models and satellite data due to poor vertical resolution in the tropopause region.
We need new observations within the waveguide at tropopause level with sufficient vertical resolution to resolve the detailed jet stream structure and quantify the diabatic processes acting as disturbances develop. We also need to connect these “upstream” observations with a comprehensive network of observations where the downstream weather impacts occur.
An experiment tackling this inter-continental problem cannot be conducted by one nation, but a unique opportunity has been created to stage a multi-platform experiment spanning the North Atlantic in autumn 2016. It is called the North Atlantic Waveguide and Downstream Impacts Experiment. Scientists from the University of Reading will join teams from Germany, Switzerland, France, USA and Canada in the experiment. The participation of two German research aircraft is already confirmed, equipped with lidar, radar and dropsondes for measuring high resolution cross-sections of winds, temperature and humidity. The photo of the German DLR Falcon aircraft (Figure 1) was taken by the author from the cockpit of the UK’s research aircraft in 2006.
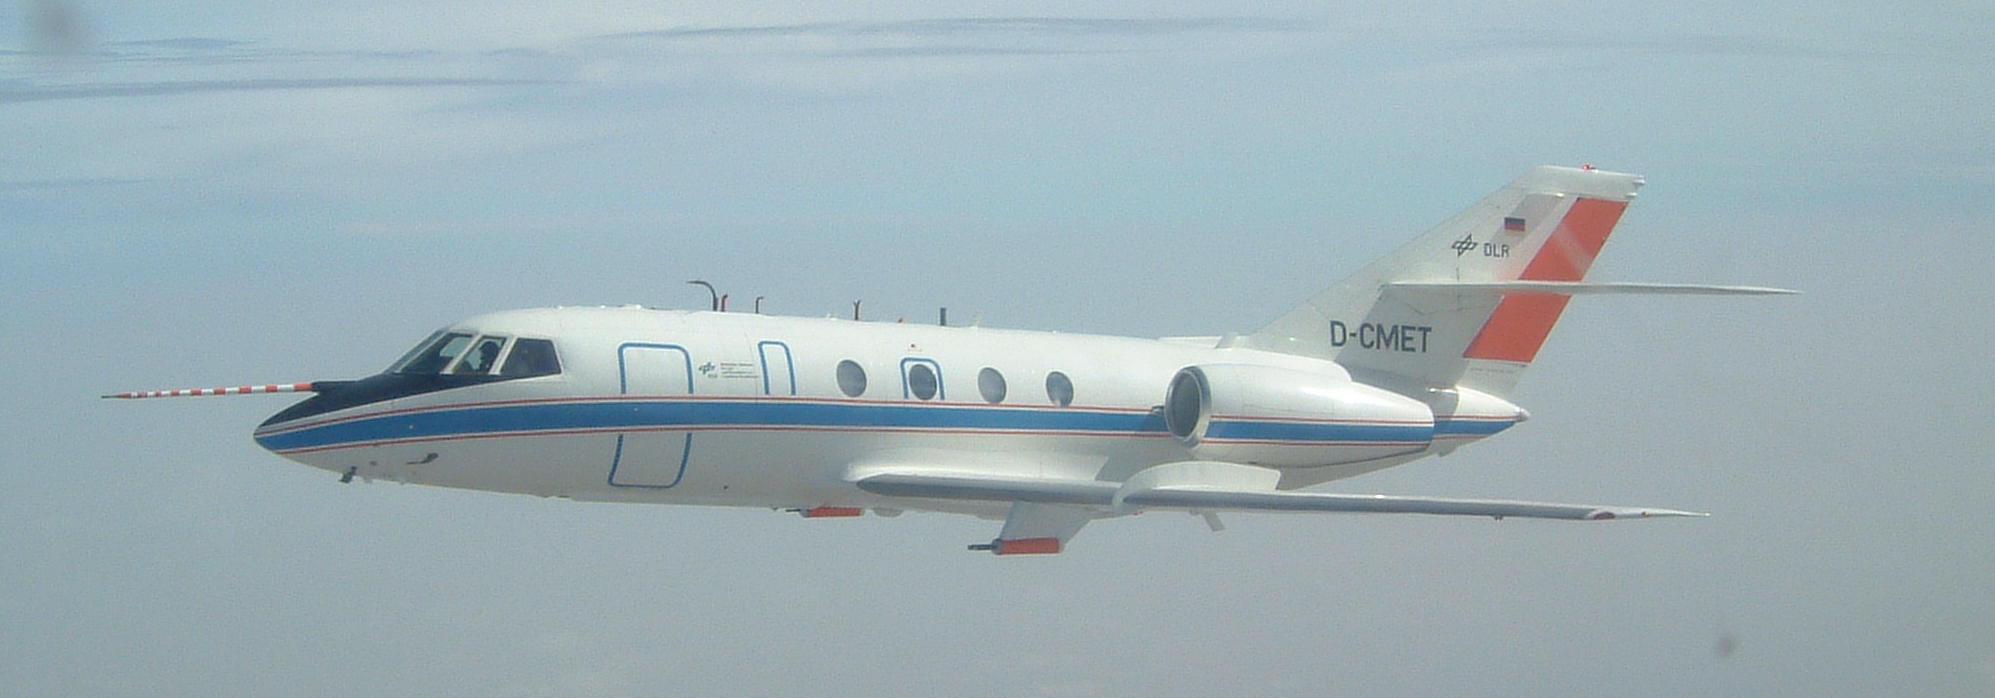
Figure 1. Photo of the German DLR Falcon aircraft taken by the author from the cockpit of the UK’s research aircraft in 2006.
Earlier this month the international NAWDEX team held a forecasting and flight planning “dry run” covering the same calendar dates as the real experiment next year. Figure 2 illustrates the shape of the jet stream at 1500 GMT 28 September. Wind barbs show the wind strength and direction at tropopause level. At this time, the very strong westerlies south of Greenland divert southwards for several thousand km on the western flank of a “tropopause trough” – so called because the tropopause is lower and the air colder where it has travelled from polar regions (blue colours). On the eastern flank of the trough there are very strong northerlies running right up across Iceland and the base of the aircraft at Keflavik (red dot). The northerlies transport relatively warm air (orange) from the subtropics towards the pole. The warm region is called a “ridge” because the tropopause is higher there. This time is shown because a flight was planned following the blue triangular path. The aim was to take two cross-sections through the ridge because we know that diabatic processes influence the altitude that the air in the ridge reaches, and its extent. This also enables us to get detailed observations of winds, temperature and humidity directly across the jet stream. The triangle apex connects with the Met Office wind radar on South Uist (Scotland) which make continuous measurements above this location. There are very few radars able to make profile measurements to this altitude. The pink dots show the two within range at Aberystwyth (Wales) and Andoya (Norway).
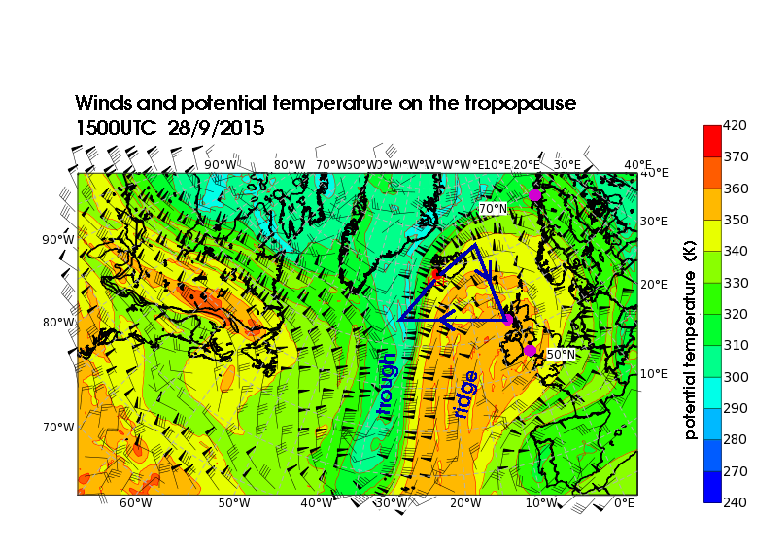
Figure 2. Tropopause-level winds and potential temperature at 1500 UTC on 28 September 2015. Forecast image produced by DLR using European Centre for Medium-Range Weather Forecasts (ECMWF) forecast data.
Overnight the ridge continued to extend polewards and Figure 3 compares the 33 hour forecast for 0900 GMT 29 September from the European Centre for Medium-Range Weather Forecasts (ECMWF) with the satellite image (2 hours afterwards). You can see that the air in the ridge (orange in the forecast) is dominated by cloud (white in the satellite image) on its western flank where the jet stream lies. This is a signature of ascent and condensation of water vapour as the air moves polewards. Much of the trough is in clear air (black in the image). This shows that you can locate the jet stream on a satellite image by the sharp contrast between clear and cloudy air.

Figure 3. Comparing the 33 hour forecast for 0900 GMT 29 September 2015 from ECMWF (left), with the satellite image for 1100 UTC on 29 September (right).
By the end of 29 September, the ridge had almost lost its connection to the south, forming a “cut-off” anti-cyclone at tropopause level centred over the UK (Figure 4). If you examine the wind barbs you will see that at this time the signature of the jet stream associated with the trough has almost been lost and the strongest winds form a straighter jet stream running from west to east over Greenland, Iceland and into Norway. At this time there were severe surface winds on the Norway coast, causing disruption.
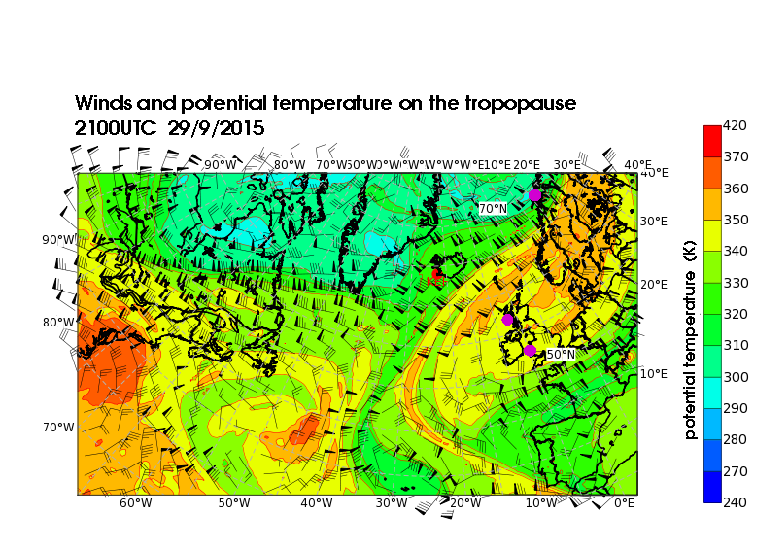
Figure 4. Tropopause-level winds and potential temperature at 2100 UTC on 29 September 2015.
The same physical processes that are poorly represented in weather forecast models also constitute a major source of uncertainty in climate model projections and make the prediction of changes in regional precipitation and wind patterns in response to global warming very uncertain. Among them are cloud microphysics, cloud radiative feedbacks, and turbulent boundary layer dynamics, which are parameterized in both weather and climate models. NAWDEX will help us to improve our representation of these processes by furthering our understanding of how the physical processes influence synoptic-scale dynamics, thereby affecting not only mesoscale sensible weather but also large-scale weather regimes. Only once the physical processes are represented well in models, can the excitation and maintenance of large-scale patterns on seasonal timescales by global teleconnections, or downscaling of climate information for the Atlantic/European sector, be tackled with confidence through numerical simulation.
We are now very much looking forward to the real experiment next year!
If the idea of taking a research aircraft into the jet stream to discover more about the atmosphere excites you, then you should consider a career in atmospheric physics. There are an ever-expanding range of employment opportunities with specific environmental physics skills, as well as more general openings for graduates with the problem solving and analytical capability that training in physics and mathematics brings. Our Department offers undergraduate degrees in Environmental Physics and Meteorology. If you have already done a first degree (perhaps in Physics, Mathematics or other physical science) you could consider the MSc in Atmosphere, Oceans and Climate, or entering directly onto the PhD programme.