Dr Nicholas Klingaman from the Walker Institute for Climate System Research at the University of Reading is an expert in Queensland’s weather and climate. He is funded by the state’s government to investigate the causes of floods and droughts and the impacts of climate change on rainfall.
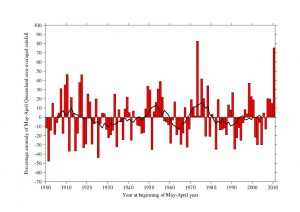
The state of Queensland, in northeast Australia, experiences considerable year-to-year and decade-to-decade variations in its rainfall. During 2000-2005, Queensland received only 84% of its long-term average rain. All of the last six years (2006-2011) have seen above-normal precipitation, however, at 133% of the average rainfall. 2011 was the second-wettest year since 1900 – only 1974 was wetter – with severe flooding in southeast and central Queensland, including in Brisbane. Oscillating periods of flood or drought are common: all years but one in 1947-1955 were wetter than normal, while all but two years in 1956-1969 had below-average rain. These variations in rainfall have dangerous consequences for the state’s agriculture, water resources and infrastructure.

For each year, the red bars show the percentage difference between the Queensland rainfall for that year and the long-term (1900-2011) average. Values larger than zero indicate wetter-than-normal seasons; negative values are drier-than-normal seasons. The black line shows an 11-year running average of the red bars, to indicate decade-to-decade variations in rainfall.
Understanding the climate phenomena that drive variations in rainfall would improve scientists’ ability to predict swings between drought and flood. A three-year project between the Walker Institute for Climate System Research and the Queensland Climate Change Centre of Excellence has investigated these climate drivers of rainfall, including the possible impacts of climate change.Our research has found that in summer (December-February), winter (June-August) and spring (September-November), El Nino and La Nina cause state-wide variations in rainfall. ‘El Nino’ refers to abnormally warm tropical Pacific Ocean temperatures; during ‘La Nina’ these waters are colder than normal. Events typically last for 10-12 months.
Heating or cooling the Pacific redistributes tropical precipitation: Queensland receives less rainfall during El Nino and more in La Nina. We have found that while stronger La Nina events lead to heavier rainfall, the drying during El Nino has no relationship to the El Nino’s magnitude.
The intense La Nina event of 2010-2011 brought severe rains to the entire state. While the strength of the connection between Queensland’s rainfall and El Nino and La Nina has varied since 1900, there is no long-term trend and hence no evidence that climate change is influencing this relationship.
Within Queensland, our analysis found that the heavily populated southeast corner – including Brisbane – and the tropical Cape York peninsula are regions of high rainfall variability. Southeast Queensland rainfall is influenced by the prevailing winds: east-to-west winds bring moist air from the ocean, promoting intense rainfall; west-to-east winds pull in hot, dry air from the continent. Rainfall in Cape York is concentrated in summer; the peninsula is dry the rest of the year. Summer rainfall is closely linked to the number of tropical cyclones that pass through or near the area.
The climate models used for the Fourth Assessment Report of the Intergovernmental Panel on Climate Change (IPCC) show little consensus on how Queensland’s rainfall will change in a warmer world. A survey of 22 models showed that by 2100, Queensland may be up to 40% wetter or 40% drier than 1961-1990. This information is of little use to those devising adaption policies.
Our research has used a model with much finer resolution than those used for the IPCC report, which provides more detail on how regional climates (eg Queensland’s) may change as the world warms. We first verified that this model, called HiGEM, could simulate the key climate phenomena that drive variations in Queensland’s rainfall. This increases our confidence in HiGEM’s projections for Queensland’s climate in a warmer world.
When HiGEM is run with twice the current carbon dioxide concentrations – equivalent to 2100 under our current emissions trajectory – Queensland summer rainfall increases by 20%. Autumn rainfall, however, declines by 25%, such that the annual-total rainfall does not change. The seasonal changes combine to compress the Queensland wet season, however. Currently, this runs from late November through early April; in the double-CO2 world, the wet season lasts only until early March. This would make Queensland much more reliant upon the heavier mid-summer rains in January and February. If the mid-summer rains were to fail, the shorter wet season would mean that the entire year would likely be dry.
Although the annual-total rainfall changes little, the number of wet days declines while the average amount of rain on each wet day increases by nearly 20%. This effect is most apparent for extreme rainfalls: the number of days with more than 100 millimetres of rain increases by 50%. These changes would have considerable impacts on agriculture and water management, as well as increasing the risk of flooding.
A clear disadvantage of our work is that we have examined only one model. Our detailed investigation of the climate drivers of rainfall, however, combined with our verification of HiGEM’s ability to simulate them, argues for giving greater weight to these results.
http://www.walker-institute.ac.uk/


