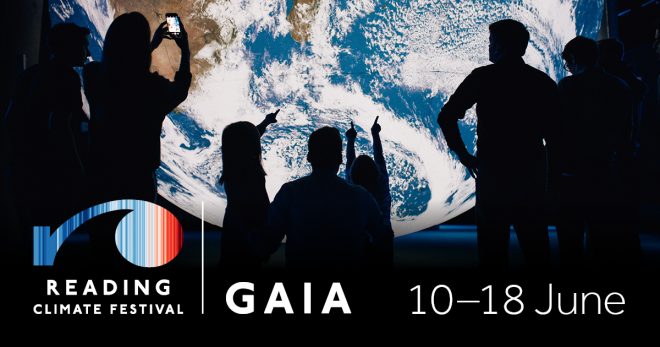
If you’re staying in Reading this summer, make sure not to miss Reading’s Climate Festival. Taking place from the 10 to 21 June 2023, the festival aims to inspire and encourage positive action on climate change.
There’s lots of events throughout the festival that you can get involved in:
- Luke Gerram’s famous installation Gaia will be on display in Reading Town Hall from the 10 – 18 June. Book your tickets. Tickets cost £2.
- Reading Climate Festival – In Conversation with Laura Tobin FRMS. Reading Town Hall, 13 June, 19:00-20:30. This event is free, however spaces are limited so please book your ticket in advance.
- Empowering young people to tackle the greatest challenge of their generation. Reading Town Hall, 15 June, 20:00-21:00. A lively debate on how to better enable and empower young people to tackle the challenges of the changing climate and decline in the natural world. The debate will be introduced introduced by Sir Alok Sharma MP, President of COP26. Places are limited, book your space.
- Whiteknights Studio Tour at the MERL. 10 – 11 June, 11:00-18:00, Museum of Rural Life. Free to attend, no need to pre-book.
Check out the Reading Climate Festival events programme, for the full list of online and in-person events taking place across the 12 day festival.
Show Your Stripes Day 2023
If you’re not in Reading this summer, never fear, you can still join in wherever you are!
Sunday 21 June is Show Your Stripes Day, join thousands of people around the world by sharing the climate stripes infographic, and unite against climate change.
There are hundreds of versions of the climate stripes, each showing global warming in countries and states around the world. Check out ShowYourStripes.info, to see and share how climate change is affecting where you live.
You can follow the activities on the day using the hashtag #ShowYourStripes and by following @UniofReading and @Ed_Hawkins on Twitter.
What are the climate stripes?
The climate stripes use bands of colour to show how temperatures in all corners of the world have risen dramatically in recent years. Shades of red are used to denote years that were hotter than the average for the period, and blues to indicate cooler years. They reveal a dramatic rise in temperatures in recent decades.
The climate stripes were created in 2018 and were made available for the public to download for free in summer 2019. More than a million people did so in the first week after they went live.
