|
By Dr. Rob Thompson (University of Reading) 4th April 2014 |
If we are looking to predict flooding from intense rainfall, we are going to need to know just how intense that rainfall really is – and where. The traditional way to measure rainfall is with a raingauge – a collector that measures the amount of rain falling into a collector of area around 50 square cm. Of course a raingauge can only measure the rainfall at the site, for areal coverage, we turn to radar.
Weather radar developed after the second world war when weather echoes had been noticed in aircraft and ship tracking radars. They developed until the 1980s when weather radar networks were being built, including in the UK. The (slightly out of date) Met Office fact sheet 15 provides an excellent explanation of how weather radar works and the addition of Doppler radar (which is something of a misnomer, it in fact does not use the Doppler shift, the effect would be too small to measure) so I won’t be repeating that. I shall instead be discussing the latest development in the UK network and one that is currently rolling out is dual-polarisation (at the time of writing there are 4 dual-polarisation radars in the UK network).

Doppler Radar Weather Station, Thurnham (1) (Danny Robinson) / CC BY-SA 2.0
What is Dual-Polarisation?
So what is dual polarisation and what does it give us? With a modern dual polarisation radar the radar considers horizontally and vertically polarised waves separately. Usually they are transmitted simultaneously and the received and separated. This leads to a range of new parameters that are of use to the radar meteorologist and therefore is of great benefit. Those benefits are only now being fully researched (including in the FRANC project by me) but include improved rejection of non-meteorological echoes, better classification of echoes (detecting rain/snow/hail etc.) and importantly, improved ability to quantitatively measure in heavy rain.
Using Radar in Intense Rainfall
During very heavy rainfall, some of the electromagnetic waves from the radar are absorbed or scattered out of the beam (that proportion of the scattering back to the radar is the radar signal), that means that there is less power in the beam beyond the rain. When rain is very heavy this can result in the beam having significantly reduced power from returns beyond heavy rain and therefore appears to show less rainfall than is truly there.
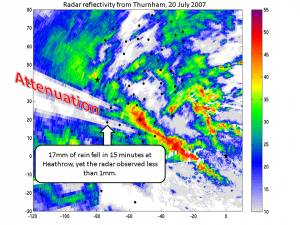
The figure shows the reflectivity of very intense rainfall event passing London on 20th July 2007. Warmer colours show high reflectivities and hence heavier rainfall. The radar is the star on the right side of the image, and it is clear to see that there is a “hole” in the radar echo behind the intense band of rainfall. This appears as a “searchlight”, and at it’s worst when the intense rain band lines up with the radar for maximal absorption of the radar beam. This particularly extreme case is also labelled with how serious the problem is, without knowledge of this “attenuation” problem, only 4mm/hr rainfall would be observed for Heathrow, when gauged measurement suggested that was 68mm/hr. Without dual-polarisation capability, a conventional radar can estimate the attenuation, but this estimate is unstable and so cannot be used to make large corrections such as required in a case like this as it could introduce greater errors than it fixed. That means that with a conventional radar just when at it’s most vital, it gives less certain results.
Dual-Polarisation to the Rescue
So why will dual-polarisation help? Amongst the parameters gained by the addition of dual-polarisation is “differential phase shift”. This is measured as the phase difference between the horizontally and vertically polarised return, the horizontal return is delayed compared to the vertical. That delay is a result of drop shapes (as described in this NASA article – this suddenly turns very technical though – be warned!) not the teardrop shape as usually depicted, but a sphere, becoming more hamburger shaped as they become larger. The shape means large drops appear larger to the horizontal wave than vertical wave, and so suffer more delay in the phase, the phase builds up as it passes through large raindrops. And of course larger raindrops generally means more rain. That gain in differential phase shift goes hand in hand with attenuation, as you can see in the figure below (the same time as the reflectivity plot above – note that this extreme case the data passes the wavelength and restarts – this is corrected in algorithms).
By using the differential phase shift as an estimator of attenuation rate, stable corrections to the measured reflectivity can be made – but what is the relationship between differential phase shift and attenuation? In fact that varies quite significantly – we need another constraint to improve further.
Radiometric Emission
That extra constraint comes from the radiometric emission of the rain, in the radar frequency. As long ago as 1859 Kirchoff’s Law was known, anything that absorbs electromagnetic waves will also emit them equally effectively. We use the radar to measure this emission as an increase in the noise where there are no scatters reflecting the beam. This can be converted to a total attenuation along the beam. Once we have a total attenuation and differential phase shift to know how to distribute that total, we can make reliable corrections.
That will lead to more accurate rainfall estimates for intense, flood producing rainfall. More accurate measurements that are fed into the computer models of both the weather and hydrology to predict the floods before they happen.


