Category Archives: Uncategorized

September Hot Spell Storms To An End

laura_baker By Dr. Rob Thompson (University of Reading)
22nd September 2016

Last week, Reading was hit by a very memorable storm in the early evening of Thursday the 15th. Then over night, in the early hours of the 16th, we were hit by another. Both storms were full of lightning, hail, and flash flooding, the perfect candidates for a article on a flooding from intense rainfall blog you might be thinking… me too.

I’ll start with some local facts, figures and reports on the weather that happened, while in Reading the storms were spectacular, the rainfall wasn’t massively high (29.6mm fell between the two storms), however rainfall was recorded as 72.2mm in Maidenhead (about ~20km East) – the second heaviest daily fall in the area since 1942. Hail was reported in Sindlesham (~5km South-East of Reading) to be 3.5cm, my south Reading home saw hail about 2cm in diameter (I suspect the largest I’ve seen in the UK). The storms marked the end of an unseasonably warm spell in the South-East, the temperature during the storm plummeted, dropping 8 degrees C in just 30 minutes. The first storm triggered ahead of the cold front moving from the south, that front being the cause of the rather longer 2nd storm. There was a lot of lightning on both storms, reaching 60 per minute over the UK area at about 4am, as the map below shows:

Probably unsurprisingly for such an intense pair of storms, the impacts were felt by the people of the Reading area. Lightning struck a house in Caversham (North-Reading), blowing a hole in the roof. But the biggest impact was flash flooding, which affected a number of roads in the area, this one of Vastern Road (which passes under the railway) shows that it filled with water causing traffic problems near one of the bridges across the Thames, reports are it shortly became impassable for a while.

The next picture is of the Sainsbury’s car park in Winnersh (very near Sindlesham) which flooded, likely much of this was melted hail!

The met office “WOW” (Weather Observations Website, which uses crowd sourced data) says there was “Minor internal property damage and/or minor external damage to property or infrastructure.” caused by hazards “Flood, Hail” in the Winnersh area, though details of this are unknown to me at the time I write.

The storms were quite different, the first very localised, the second much more widespread, but still very variable spatially. We seem to have been lucky the impacts were not more serious.

SINATRA Researcher hacked the GloFAS

download By Dr. Albert Chen (University of Exeter)
21st January 2016

The FFIR-SINATRA Researcher Dr Albert Chen at the Centre for Water Systems (CWS), University of Exeter, has participated in FloodHack and won the First Winner Prize.

The FloodHack was a hackathon event on Global Flood Awareness System (GloFAS) held on 16 and 17 January 2016 at the European Centre for Medium-Range Weather Forecasts (ECMWF) in Reading, UK. It was organised by the ECMWF, supported by the Copernicus Emergency Management Service Program, to look for innovative solutions to overcome the existing challenges that GloFAS is facing. 40+ participants with a wide range of backgrounds (education, computer science, physics, hydrology, geography, etc.) attended the FloodHack event and formed five teams to develop the solutions.

pic1(Photo courtesy: Silke Zollinger)

Dr Chen teamed up with three Software Developers, Miss Laura Ludwinski, Mr Sam Griffiths and Mr Paul Barnard from JBA Consulting, the Physicist Dr Peter Watson from Oxford University, and the Hydrologist Dr Li-Pen Wang from KU Leuven.

They developed the software LIVE (Logistic and Infrastructure Visual Evaluation) to summarise the detailed flood forecasting information from the GloFAS into a ‘Time to respond’ map that allows the decision makers having better understanding of available time to act for flood mitigation. The LIVE can also help prioritise the resources allocation so the areas with the most urgent flood threat will receive immediate attention.

pic2(Photo courtesy: Florian Rathgeber)

The objective and the workflow were determined in the first round of group discussion. Therefore, each member of the team LIVE contributed individual’s skills and knowledge to complete the subtasks, including information collection and extraction, data processing and analysis, and visualisation. Python scripts and the QGIS were the main tools the team LIVE adopted to develop the solution. After 27 hours of intense collaboration and countless cups of coffee and Redbull, a prototype of LIVE was completed.

The outcome of each team was presented to all participants in the afternoon of the second day, and judged by a panel consisted of professional software developer, telecoms expert, environment and technology consultant, web technologist, and crisis manager. The judging criteria included (1) potential for innovation (2) relevance/usefulness (3) technical merit (4) design/user (5) experience/polish and (6) “wow” factor.

Five projects were presented, including

  • FloodIT to offer refined flood information based on the GloFAS to help local users understand their situation.
  • The (flooded) Italian Job that analysed big data to determine spatial varied flood warning thresholds for the GloFAS.
  • LIVE provided “Time to respond” maps to help emergency management.
  • Interception that adopted the GloFAS as an educational platform to raise flood awareness.
  • GloFAQ to identify infrastructures based on the GloFAS that are at risk of flooding.

The panel was impressed by team LIVE and their excellent application of the GloFAS data that can potentially benefit global stakeholders with different needs. The technology was also ready to make further applications achievable. As a result, the team LIVE was announced as the First Winner of the FloodHack.

pic3(Photo courtesy: Florian Rathgeber)

Dr Chen thanks the talented teammates who successfully implemented the LIVE software. His knowledge gained from the FFIR-SINATRA project has been proven as valuable inputs to the team for developing the application. The FloodHack experience will also help the FFIR team to integrate the FRANC and SINATRA in the next stage of research.


Designing Convection-permitting Ensemble Forecasts

DF_AZ By David Flack  (University of Reading)
18th January 2016

In my previous blog I talked about the different convective regimes that flash floods occur in, and was in the early stages of my PhD. My work has moved on a fair amount since then and I have started to look into ensemble forecasts of convective events. I have spent a fair amount of my PhD working out a design for a convection-permitting ensemble, so I thought I’d write a bit about the process to help show the uncertainties we currently face in predicting thunderstorms.

Now, ensembles (and their uses) have been covered a fair amount in this blog, as have advances in forecasting in which it was mentioned that probabilistic forecasts could be made from well-spread ensembles that take into account the true uncertainties in a forecast. But one of the key questions in convection-permitting ensemble research groups is how do we represent the uncertainties?

This question has many answers, I suggest here a couple of ways in which we could look at the uncertainties, but before I do I will give a brief reminder of what an ensemble is and how it works. Traditionally a model would be run with one realisation in a deterministic fashion, and that would be the forecast. However, is we were to nudge (perturb) the starting conditions, model physics or boundary conditions (or all three) of the run we could (provided the ensemble is well-spread) create equally likely outcomes and hence a probabilistic forecast of whether or not is would rain tomorrow (Fig. 1).

FFIRblogFlack

Fig.1: Deterministic and ensemble forecast, dark red crosses show the starting and ending positions of the forecast and the bright red cross shows the truth. The dotted lines show the path of the forecasts and the red circles indicate the range of starting positions and possible forecasts.

So how can we try to take into account the uncertainties? Well to start to answer that we need to know what could be uncertain about a forecast, three things come to mind immediately – the location, the timing and the intensity of rainfall.

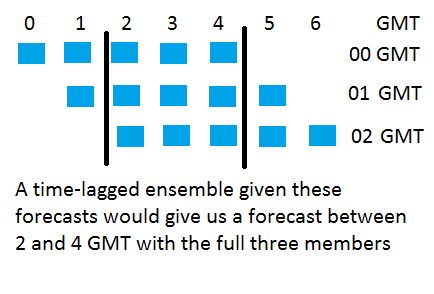
How can we take some of these things into account? Well I mentioned earlier we could change the initial and boundary conditions of the model – this could be done by a process of time lagging, by which we look at previous forecasts and create an ensemble member over times that they all cover (Fig. 2) this may give an idea into when the convection could actually occur, and may even go some way to changing the position and or intensity of the event.

FFIRblogFlackFig2

Fig. 2: Time-Lagged ensemble schematic. For a forecast initiated at 00, 01 and 02 GMT we can create an ensemble for 2 – 4 GMT based on the data points shown between the two black lines.

We could also take the option of tweaking the model physics slightly, we could do this by adding a field of random numbers every so often into model and run these new numbers through the model, we could use different parameterisations or using aspects of the behaviour of the event we are trying to forecast, like add stochastic noise into a process that is stochastic in nature.

These suggestions are just a couple of ways of taking into account uncertainty. I am by no means claiming these are the best ways or the only ways, and they certainly do not take into account the full uncertainty in the atmosphere, but at least it’s a start in the right direction. However, these types of differences do produce different realisations of the atmosphere and hence different forecasts for rainfall events, so can be used in giving us probabilistic forecasts of flash floods and other events.

The next thing to concern us though is how do we actually interpret, communicate and verify probabilistic forecasts, but this is a completely different topic which I will not cover in this blog. However, to give you a clue it takes more than one forecast to verify a probability.

Flooding from Storm Desmond in Northumberland and Cumbria

GeoffParkin By Dr Geoff Parkin  (Newcastle University)
14th December 2015

The Sinatra Flood Action Team (FloAT) has been in action following the extensive flooding from Storm Desmond and the rain that both preceded and followed it.

The headline figure was the new highest ever UK 24-hour rainfall, with 341.4mm of rainfall reported for Honister Pass in Cumbria in the period up to 1800 GMT on 5 December 2015, and a new 48-hour record of 405mm also being recorded at Thirlmere in Cumbria [1]. Many records were also broken in river levels across the north. The combination of extreme rainfall and river levels and flows has led to significant geomorphological changes, which FloAT have been recording and surveying using dGPS and terrestrial laser scanning equipment.

The storm centre tracked to the north of the British Isles, with a long weather front remaining in an almost static position across Scotland, bringing strong winds and persistent rainfall over a wide area of northern England and southern Scotland. The most intense rainfall was to the wast of the Pennines, caused by strong orographic uplift, as warm moist air was forced upwards by the hills, resulting in cooling, and condensation of moisture into droplets forming the rainfall. To the east of the Pennines the opposite effect happened, as the air mass (with reduced levels of moisture) flowed downwards, causing warming which allowed it to retain the moisture and suppressed rainfall. For Storm Desmond, this rainshadow effect was particularly noticeable, with negligible amounts of rainfall being recorded near the east coast.

In north-east England, preliminary analyses (to be confirmed) of rainfall and river flows have been made by the Environment Agency (see attached factsheet, provided with permission by the EA). These show clearly the record-breaking rainfall totals across the Pennines, with accumulations over 24 hours and above estimated to be well in excess of 1 in 100 year return periods (note that even these may be under-estimated, due to the high winds), and the rapid drop in rainfall totals towards the east.

In the Tyne catchment, river levels have exceeded the previous maxima within the periods of records for the North Tyne and the main Tyne, including at the lowest non-tidal gauging station at Bywell (61 years of record). Comparison of the peak levels against historical records (as reported by David Archer) show that levels in this event exceeded those of the 1815 flood by about 0.4m, but still did not reach those of the great flood of 1771, which caused the collapse of the original Tyne Bridge and resulted in several deaths [2]. A wider analysis of historical information (to be reported in a paper focussing on flash floods for  Hydraulics Research, currently under review) has shown the value of this type of historical evidence in understanding of flood-rich and flood-poor periods.

fig1Debris washed against the 19th century bridge across the River Tyne at Ovingham in Northumberland (Photo: Andy Russell).

There has been extensive damage to bridges across the whole area affected during this event. Along the River Tyne, the 19th century bridge at Ovingham had just been opened on the Thursday before the storm, following 18 months of refurbishment. Extensive build-up of debris against the scaffolding has caused it to be closed to traffic until its structural integrity can be checked. Debris during floods can cause structural damage to bridges through direct impact, as well as exacerbating scour of foundations.

fig2

Mixed large and small woody debris, brought downstream from riparian areas in the catchment, and left with thick deposits of silt on floodplains (Photo: Andy Russell).

In Cumbria, the extensive damage in many cities, towns and villages and the further rainfall this week has meant that the priority has been on safety and recovery, and the FloAT field activities are always careful to recognise this and to carry out the research work in a sensitive and sympathetic way. However, they have been able to visit some of the worst affected areas, and have carried out surveys of wrack lines in Keswick, and of the debris fan developed downstream of Glenridding, where further rainfall during this week has caused more movement of material even during the recovery activities.

fig3

Mixed debris blocked against a hedge barrier. This can affect flood flow directions dynamically during events, as indicated by the flattened grass (Photo: Andy Russell)

In Keswick, the River Greta overtopped recently installed flood defences upstream of the A5271 Bridge.  At this location inundation depths and sediment loads greatly exceeded those for the November 2009 floods.  In places, properties were inundated by flows depths of 1m.

fig4

Clear-up operation in Glenridding. Excavator is removing large amounts of sediment deposited upstream of the bridge in river channel and village centre (Photo: Andy Russell).

Glenridding was inundated with water and large volumes of coarse-grained sediment during Storm Desmond.  A landslide further up the catchment translated into a hyperconcentrated flow allowing further entrainment of sediment from the channel margins. The A592 bridge became choked with sediment allowing several metres of sediment aggradation in the village centre, most notably around the Lake District National Park visitor centre.  A large sediment fan was deposited downstream of the Glenridding Hotel by flows which burst from the walled main channel.

fig5

Large volumes of coarse-grained sediment deposited in the centre of Glenridding (Photo: Andy Russell).

Subsequent analysis of the data collected from this event will improve understanding of the role of debris and geomorphological change during extreme rainfall and flooding, and support our abilities both to model catchment and urban hydrology and to manage their impacts on infrastructure.

fig6Steve Birkinshaw surveying large debris fan downstream of Glenridding (Photo: Andy Russell). fig7Laser scanning the Storm Desmond debris fan at Glenridding (Photo: Andy Russell).

Written by Geoff Parkin, Newcastle University, on behalf of FloAT (Matt Perks, Andy Russell, Andy Large) and David Archer, 14 December 2015.


A New Era in Forecasting

DSC02392 By Prof. Peter Clark (University of Reading)
10th August 2015

How do we measure progress? We often talk about a ‘quantum-leap’ (ironically, the smallest change known to physics), or a ‘step-change’. Both are meant convey jumping to a new level, rather than just a gradual improvement. When the Met Office made their ‘convection-permitting’ model operational in 2009, they were making such a leap, but I prefer to think of it as entering a new era. We are at the start of a journey, not the end. We are trying to do something we have not done before. Our position on the journey to forecast reliably the convective storms responsible for intense rainfall is akin to where we were for synoptic-scale weather systems such as extra-tropical cyclones in the 1970s, when the idea of using numerical simulations of the physics running faster than reality to make predictions became a routine.

In those days, our models grossly under-resolved the flows of we needed to forecast. I have fond but frustrating memories from the early 1980s of using output from the regional ‘fine-mesh’ (75 km) model to plan research flights. Forecasting 24 hours ahead was a pretty hit and miss affair, especially if one needed the right airmass to be over the area one had clearance to fly in at the right time. The objects of interest (cyclones) were grossly under-resolved, with consequent systematic errors in timing and development. Major ‘busts’ happened, of course, such as the Great Storm of October 1987. Nevertheless, forecasts were useful. Over the last 40 or so years we’ve made steady progress and reached the point where not knowing the synoptic-scale quite accurately 2-3 days ahead is a rarity, and we often have a very good picture even further ahead.

None of this progress enabled us to predict the location and intensity of convective storms directly. It helped the forecasting process, of course, by telling us, with increasing accuracy, the broad regions where storms might occur, but no more, for the simple reason that they were not designed to do so. They were not designed to ‘resolve’ the storms. Beyond that simple statement, as a result, they were explicitly designed to prevent such storms from occurring, by recognising the atmospheric instability that produces the convective clouds and removing it, in a way designed to try to mimic the way that convective clouds remove the instability.

We often talk about model resolution in the same way as we talk about the resolution (in megapixels) of our digital cameras. This may convey some sense of what is going on, but the idea that there is some underlying ‘full-resolution reality’ over which our model averages is not a helpful way to understand how the model works. We may be trying to predict such an average, but we have nothing to average over, and so have to predict how the average will change in the future knowing only our best estimate of the average now and without any knowledge of the complex flows, such as thunderstorms, happening within our ‘pixels’. This process is known as ‘parametrization’.

A major consequence of this is that our models cannot always behave correctly. In particular, they fail to recognise the interaction between storm flows that can lead to organised and relatively long-lived systems of intense rainfall called ‘mesoscale convective systems’ or MCSs. These represent one of nature’s finest examples of order growing out of chaos.

For example, a small but intense MCS formed from isolated convective showers during the late afternoon and evening of 13th June 2014, propagating slowly south and finally crossing the south coast at about 0500 UTC (Fig. 1). By midnight it had formed an organised system shown in Fig.  1. This shows the radar-derived rainfall rate compared with forecasts of rainfall rate from the convection-permitting UKV (1.5 km) model and the convection–parametrizing Global (25 km) model. The latter, rather than forming an intense organised system, indicates convective showers which die out as the solar heating wanes.

nimrod_140614


Figure 1: Radar-derived rainfall from 13-14th June 2014 showing the evolution of an MCS over central Southern England.

So, when we made the decision to design weather forecast models that actually simulate thunderstorms, we entered a new era. This era has many similarities with the early days of numerical weather prediction (NWP). The objects of interest (thunderstorms) are grossly under-resolved, with consequent systematic errors in timing and development (Lean et al., 2008; Stein et al., 2015). Sometimes events are very poorly forecast. Nevertheless, forecasts are useful. We are beginning to learn when to rely on them and when not to.  We should hope and aim for future improvements, including those that will arise from the FRANC project. It is, perhaps, no coincidence that the first new forecast product to emerge from the new forecast system was the ‘Extreme Rainfall Alert’.

fig2

Figure 2 Mesoscale Convective System (MCS) over the UK represented by instantaneous rainfall rates (mm hr-1) for 0000 UTC 14th June 2014. (a) Radar-derived rainrates at 1 km resolution (b) UKV MetUM T+9 forecast started at 1500 UTC 13th June 2014 and (c) Global T+12 forecast started at 1200 UTC 13th June 2014.


There is, however, one difference in characteristics we have to learn to appreciate fully. The lifetime of an extra-tropical cyclone is a couple of days. That of a thunderstorm is only a couple of hours. We might realistically expect to be able to follow the lifetime of one thunderstorm in a forecast model, but only if we can detect it early enough and persuade our model to start generating a storm in the right place at the right time. The perhaps 6-hour time window we might use to detect how a cyclone is beginning to develop might be equivalent to 15 minutes to see the early stages of convective cloud.

At present we have remarkably little observational information to enable us to do this. Weather radar is our most powerful tool, and much of FRANC is devoted to making the most of the information we get from it. But most of the information we get from it relates to quite late in the lifecycle of storms. We need other information about clouds and their precursors for a realistic forecast system.

We can have little expectation of forecasting exactly what happens beyond, or even during, the lifetime of a single convective cloud; the knock-on effects of evaporation of cloud and rain, interaction with the surface etc. etc. are far too sensitive to predict exactly. (The structure of the MCS in Fig. 2 is not well-forecast 9 hours ahead). We have to make use of probabilistic forecasts, generally by means of ensembles of forecasts. The key requirement is that such ensembles accurately represent the true uncertainty in a forecast. At the same time, we will have to learn (and then teach others!) how to interpret and use what will, on the face of it, appear to be very low probabilities. There is a huge difference between predicting the probability of a 1 in 100 year event at a given place (e.g. a few streets in a town) and the probability of such an event, say, somewhere within 10 km of that place.


References

Lean, H. W., Clark, P., Dixon, M., Roberts, N. M., Fitch, A., Forbes, R. and Halliwell, C. (2008) Characteristics of high-resolution versions of the Met Office unified model for forecasting convection over the United Kingdom. Monthly Weather Review, 136 (9). pp. 3408-3424. ISSN 0027-0644 doi: 140.1175/ 2008MWR2332.1

Stein, T., Hogan, R., Clark, P., Halliwell, C., Hanley, K., Lean, H., Nicol, J. and Plant, B. (2015) The DYMECS project: a statistical approach for the evaluation of convective storms in high-resolution NWP models. Bulletin of the American Meteorological Society. ISSN 1520-0477 doi: 10.1175/BAMS-D-13-00279.1

Surface water flood warnings in England: overview, assessment and recommendations

DSC02392 By Susana Ochoa Rodríguez (Imperial College London)
23rd July 2015

As noted in several previous articles and as the readers of this blog are well aware of, surface water flooding (SWF) is an increasingly growing hazard in the UK and around the world. What is more, the localised and fast (flash!) nature of this type of flooding make it very challenging to forecast and manage. Significant progress has been made in recent years in improving the prediction and management of this type of flooding in England; however, a number of challenges still remain.

As part of the European RainGain project, a study was recently conducted to examine users’ understanding of currently available SWF warnings in England, identify their benefits and shortcomings, as well of ways of improving them and making best use of them. This was done based upon survey responses from local authorities across England and the outcome workshops with a range of flood professionals. The full study can be accessed here. In what follows the main findings of this investigation are presented. This is preceded by a brief overview of recent developments in and currently available SWF warnings in England.

Recent developments in and currently available SWF warnings in England:

Although SWF started to gain attention a couple of decades ago, it was the flood events of the summer 2007 which brought into sharp focus the risk imposed by this type of flooding, raising awareness and triggering substantial efforts to improve its prediction and management. A significant step forward in this direction was the development of the rainfall threshold‑based Extreme Rainfall Alert (ERA) service which was piloted by the Met Office and the Environment Agency in 2008 and then issued operationally from 2009 by a new joint Flood Forecasting Centre (FFC). In 2011, the ERA service was superseded by a more sophisticated SWF risk assessment (SWFRA) which takes into account rainfall thresholds, parameters on the ground and potential impacts in order to estimate the risk of this type of flooding. The main recipients and users of the former ERAs and the current SWFRA services are the district and county local authorities.These authorities have been recently required by government to play a leadership role in the management of SWF.

Experiences, views and requirements of local authorities with regard to the SWF products provided by the Flood Forecasting Centre:

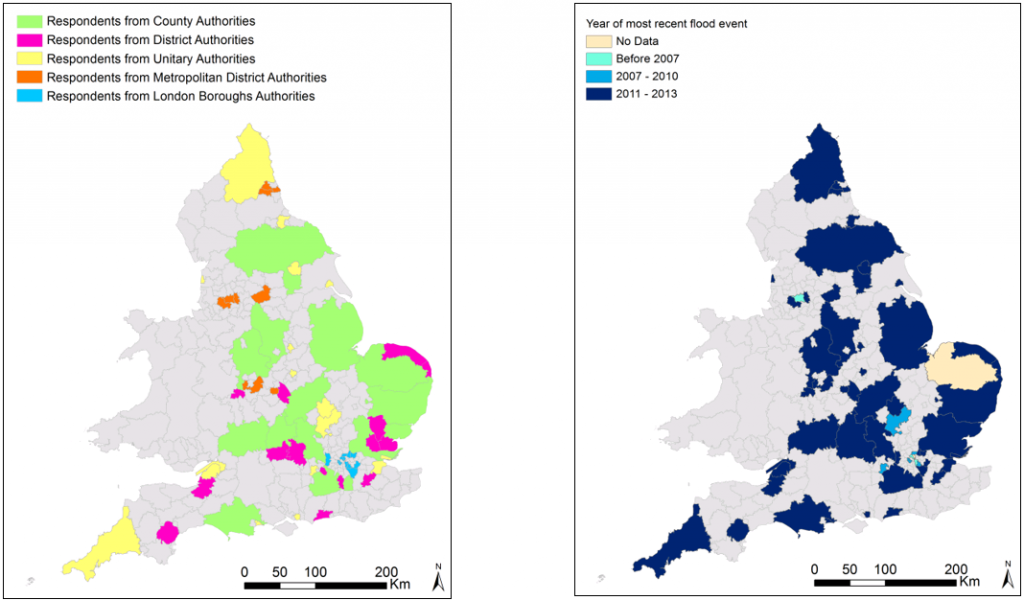
The experiences of local authorities with the 1st generation ERAs and 2nd generation SWFRA alerts, as well as the benefits and shortcomings of these warning services were investigated through survey responses from over 70 local authorities across England (Fig. 1).

figure1

Figure 1: (a) Location of survey respondents; (b) Year of most recent SWF event in the area of jurisdiction of survey respondents

Some of the main findings of this investigation are the following:

  • Local authorities in England have a basic understanding of the ERA and SWFRA services, but do not understand the rationale behind them nor their differences in depth and would benefit from additional information (Fig. 2). A key aspect in this regard is limited understanding of the difference between hazard and risk.
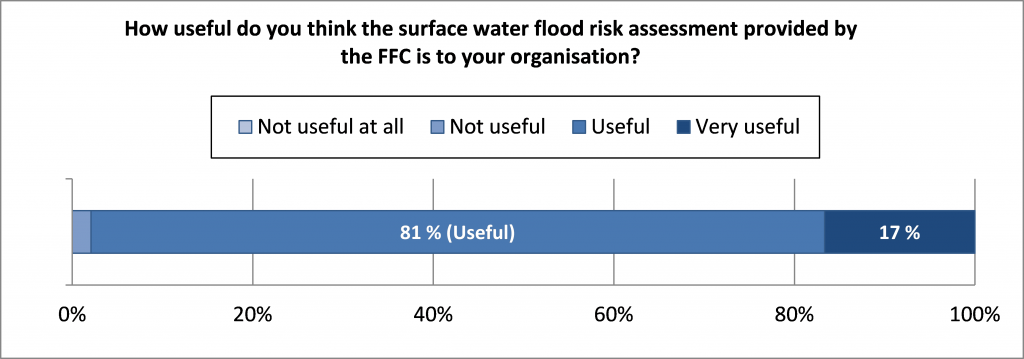
  • In spite of the above, the current SWFRA service is considered useful by most local authorities (Fig. 3), giving them a general overview of the risk of SWF and helping them to prepare for flood events. In fact, most local authorities currently take some action upon receipt of SWFRA alerts, with the type of action depending on the risk level and lead time of the alert.
  • Local authorities are more reactive to the new SWFRA service than they were to the former ERAs. This is a positive and encouraging development towards increased resilience to SWF.
  • According to local authorities, the main drawback of the current SWF risk assessment service is its broad spatial resolution (i.e. county level) which is insufficient given the localised nature of SWF. More geographically targeted warnings are therefore desirable.
  • If more localised warnings were available, the minimum probability of occurrence at which local authorities would be willing to implement substantive action is 40 %. However, warnings with as little as 20 % probability would still be useful for triggering low cost precautionary measures such as monitoring of critical areas. Furthermore, local authorities said that warning lead times of at least 2 hours would be desirable, although localised and high probability warnings with lead times as short as 30 min were still deemed useful.

figure2

Figure 2: Local authorities’ understanding of ERAs and SWF risk assessment services

figure3

Figure 3: Usefulness of the SWFRA service to local authorities

Analysis of alternatives for improving the current SWF forecasting and warning systems:

Alternatives for improving the current SWF risk assessment service were analysed during workshops with a range of flood professionals. The main conclusions of these workshops are the following:

  • Flood professionals believe that, despite improvements, the service provided by the FFC will continue to be a national service and it is unlikely that it can ever deal with the fine detail of some local areas, particularly complex urban areas. Therefore, a two-tier national-local approach is considered more appropriate for generating localised SWF forecasts and warnings for hotspot areas. In this case, a main meteorological and broad flood forecasting and warning service at the national level would be provided by the FFC, and local forecasting and warning systems (which would get input from the national service) would be operated by local authorities in collaboration with the EA.
  • Three technical options were considered for the local forecasting systems: (a) empirical scenarios-based system; (b) pre-simulated scenarios-based system; and (c) real-time simulations-based system. Considering the requirements of each of these systems and current monetary, human and technological resources a type (b) system was deemed to be more appropriate in the short term, as it represented a good balance between costs, benefits and practical delivery. The development of such a system could be outsourced to consultants or local universities and cost savings and synergies could be achieved by working in partnership with neighbouring local authorities, water companies and the EA.
  • Some of the main constraints for the successful implementation and effective use of any local SWF forecasting and warning system include the insufficient accuracy of currently available rainfall estimates and forecasts, the lack of capacity at local authorities and the low levels of public flood risk awareness. Efforts should therefore be concentrated on overcoming these challenges.

Surface Water Flooding in Aberdeen

By Richard Maxey (Flood Forecasting and Warning Scottish Environment Protection Agency)
10th July 2015

This blog entry is repeated from the Scottish Flood Forecasting Service, the original can be found here.

As noted in previous articles surface water flooding can be challenging to forecast. On Tuesday 7th July a period of intense rainfall over Aberdeen and the surrounding area led to significant surface water flooding. The forecasting service was able to provide timely guidance and alerts.

synoptic

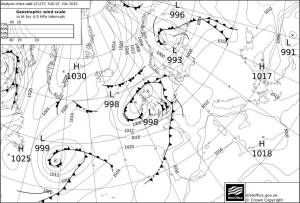
Synoptic situation leading up to the event

The threatening weather situation leading up to the flooding in Aberdeen was initially forecast the preceding weekend. In the build up to Tuesday, an associated low centre was expected over Aberdeenshire and Aberdeen City. The airmass was relatively moist and potenitally very unstable. Many of the conditions for localised downpours were evident. Namely, unstable air, warm daytime temperatures, slack flow and some changes in wind direction aloft. On the day, temperatures quickly reached the values required to set off the heavy and thundery showers. Initially over high ground to the southwest of Aberdeen, gradually drifting northeast over the city. The showery procession may also have been reinforced by ‘convergence’ along the coast. A sea breeze effectively adding impetus to an already fraught situation. A process called ‘back-building’ may also have played a part. This is when a shower cloud sets of ‘daughter cells’ behind it as it moves with the main steering flow. Met Office weather predictions models were suggesting some high rainfall totals over a short period of time and these predictions were reinforced by associated probability forecasts.

forecasts

Met Office forecasts in the run up to the event. Heavy Rainfall Alert probabilities of 30mm/3hr (significant impacts) from MOGREPS-UK, left, and deterministic UKV, 3hr totals, right

The exact location, intensity and timing of heavy showers are notoriously difficult to forecast. Scottish Flood Forecasting Service (SFFS) meteorologists and hydrologists did however decide there was enough evidence to warn of the risk of significant ‘surface water’ impacts on the preceding Monday. This risk was repeated in the SFFS Flood Guidance Statement and accompanied by alerts on the day of the flooding.

Area of Concern map from 7 July Flood Guidance Statement

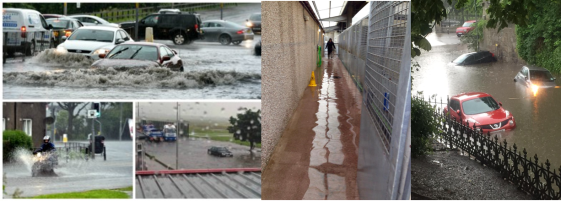
The event caused significant disruption. Impacts included flooded properties, roads and commercial premises, including a shopping centre. The airport terminal was flooded, as was a dogs’ home. Children had to be evacuated from a nursery.

flood pic Aberdeen 1

Flooding impacts in Aberdeen, from Press and Journal

The rainfall was of the order of 10mm in 1 hour, or 20mm in 3 hours, as recorded at various gauges and by the nearby Hill of Dudwick rainfall radar. At individual locations, this would indicate a return period of around 5 to 10 years, however given the relatively widespread nature of the event, with these totals being recorded over several square kilometres, the actual return period of the event could be much higher. Taken as isolated spot values, and comparing with our depth-duration guidance thresholds, these figures would normally indicate expected impacts in the minor category, but given the widespread nature of the rainfall, it is unsurprising that impacts were significant. The cumulative effect of this event following another heavy rainfall event on the preceding Saturday, and the high tide restricting drainage from some areas, may also have increased the severity of flooding.

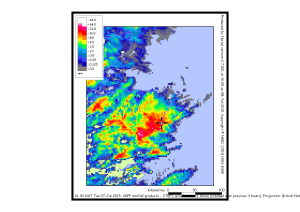
Hyrad 3hr

3 hour rainfall accumulation from radar. Widespread 20mm totals.

Given the current availability of tools and resources the forecasting service performed very well. However the less predictable and smaller scale event (with mainly minor impacts) in Aberdeen just three days earlier did not get the prominence it perhaps deserved, meaning there is still quite a lot to do to if the Scottish Flood Forecasting Service is to have a comprehensive, consistent and accurate capability in the difficult and challenging area of surface water flood forecasting.

The forecasts (particularly the Heavy Rainfall Alert tool) suggested there was >40% probability of significant impacts for the 32x32km grid square in which Aberdeen is located at one corner. This would have yielded a medium (amber) flood risk on the Flood Guidance Statement, however as it is sometimes felt that extreme event probabilities can be overdone, a lower probability was assumed for the urban area. A new version of the HRA tool, which comes online for use by the forecasting service later this summer, will better target urban areas and make this kind of decision making a little easier. A detailed surface water flood risk mapping tool, similar to that used in Glasgow for the Commonwealth Games last summer, would also improve forecasting of this type of event, and we plan to further develop the scope of this model in future.


This blog entry is repeated from the Scottish Flood Forecasting Service, with the permission of the author, the original can be found here.

FCERM Blog for FFIR

pic10 By Dr. Chris Skinner (University of Hull)
16th June 2015Images from Dr Lila Collet of Heriot-Watt university

On the 27th May I headed up to Edinburgh for the FCERM.net Annual Assembly. FCERM.net is the Flood and Coastal Erosion Management Network, set up from Heriot-Watt University with the aim to bring together researcher and practitioners, each with an interest in FCERM. The meeting opened on the evening of the 27th with a conference dinner at The Hub on Edinburgh’s Royal Mile. This was finished off with a post-dinner address by Prof Roger Falconer, who inspired us to consider the importance of water and our own personal water footprint.

Dr Christel Prudhomme gave the first keynote, on ‘Climate Change Impact Assessment and Flood Resilience’ – she stressed that the key to effective communication on climate change issues start with agreeing a common language, communicating uncertainty and allowing for risk based decisions. The second keynote came from Professor Jim Hall on ‘Flood Risk Analysis and Investment Planning’. He explained the main risk areas around water – flooding, drought, harmful environmental impacts and inadequate supply or sanitation – and proposed a portfolio based approach of information, institutions and infrastructure to address these.

pic13

The next part of the meeting was dissemination of results from past ‘sandpit’ projects – Blue-Green Cities, SESAME and Flood Memory. The Flood Memory project investigated the impacts of multiple flood events, as the flood risk of a catchment changes over time and most significantly after a flood event. This was particular relevant to my research, as its one of the main drivers behind our part of NERC FFIR. The rest of the meeting was devoted to looking at how researchers and practitioners can work together to deliver better FCERM – for us this is how we can convert the findings of our research into practise.

pic12

Concurrent with the meeting was the poster session. The theme of the meeting this year was ‘Dissemination’, and I was presenting my work with SeriousGeoGames (SGG), demonstrating Humber in a Box via Google Cardboard headsets. This generating a lot of interest (so much so I nearly missed out on lunch), and it won one of the poster prizes at the meeting – I got to talk to more people about the science behind the model as they wanted to see what the headsets were about. I’m hoping to apply some of this work to the FFIR project in the future.


pic11 qr

Thanks to Dr Lila Collet of Heriot-Watt University for the images used in this blog.

The role of woody debris during floods: insights from observations of fluvial process and form in northern England

ARussell By Prof. Andy Russell (Newcastle University, School of Geography)
28th May 2015  – @Floodpower
http://www.ncl.ac.uk/gps/staff/profile/andy.russell

Accurate prediction of flood inundation area and hydraulics requires knowledge of channel characteristics such as cross-sectional area, shape and individual roughness elements (e.g. boulders).  The resistance exerted by the channel and its characteristics govern: local, cross-sectional and reach scale hydraulics.  Channel characteristics and consequent flow conditions during floods can be altered considerably by the introduction of floating debris and sediment, thereby increasing flood risk.

Record breaking floods in Northumberland and Cumbria in 2008 and 2009 respectively, provide insights into the role that woody debris plays in altering flow conditions and consequent channel morphology.

fig1

Floating debris is introduced to river channels either by entrainment from within the river channel and river corridor/flood plain or by hillslope failure (Fig. 1). Timing of introduction of floating debris to a flood may be controlled by the exceedance of critical thresholds for debris entrainment via flotation or river bank and hillslope failure.  During the September 2008  Coquet River woody debris was entrained and transported during the  flood peak and waning stage suggesting the operation of thresholds for entrainment at higher discharges (Fig. 2). Note that debris mantles fence lines providing much greater resistance to waning stage flood flows than on rising stage.

fig2

Woody debris accumulations along fence-lines and between riparian vegetation can deflect flow and cause localised backwater effects raising local water levels (Fig. 3).

fig3

Flood transported trees tend to be transported with their roots facing up flow thereby minimising their resistance to flow (Fig. 4).

fig4

Isolated grounded large woody debris can act as major obstacles to the flow resulting in classic obstacle marks characterised by proximal scour hollows and distal ‘tails’ of sediment in the their lee (Fig. 5).   Large debris accumulations can also result in flood flow deflection producing localised zones of lateral river bank erosion (Fig. 5).

fig5

Floods within high gradient streams can produce very large debris dams (Fig. 6).  These accumulations often mimic the step and pool morphology of high gradient stream channels. Large trees act as log catchers preventing large woody debris travelling downstream and clogging-up bridges.

fig6

In some instances modern bridge design is less effective in allowing the passage of large woody debris and sediment than earlier designs (Fig. 7a).  In many cases large volumes of woody debris are removed from bridges and other structures during floods (Fig. 7b).  Although such interventions are likely to be crucial to reduce flood risk in the vicinity, their role is seldom considered by hydrologists and hydraulic modellers in the aftermath of specific flood events.

fig7

It is clear that the woody debris exerts a major influence on flood flow dynamics and geomorphological impact.  As such it is crucial to consider how and when woody debris is introduced to flood flows as well as the impacts of transient and grounded debris on flood hydraulics.


NEW INSIGHTS INTO UK INTENSE RAINFALL – FROM SCIENCE TO POLICY

SB By Dr. Stephen Blenkinsop (Newcastle University)
6th Feb 2015


The NERC-funded CONVEX (CONVective EXtremes) project held a workshop on intense rainfall and flash flooding in January at The Royal Society in London. The event brought together academics and stakeholders from government and the private sector to discuss the latest understanding of UK intense rainfall and how this new knowledge might be developed into policy guidance.

fig1

Presentations by CONVEX scientists from Newcastle University and the Met Office highlighted the latest advances in the development of sub-daily rainfall observations for the UK, new understanding of the mechanisms of intense rainfall and results from the first very high resolution (1.5km) climate change experiment which provide evidence of heavier summer downpours for the UK.  The day also featured presentations from Mary Stevens of the DEFRA Floods Programme and Molly Anderson of the Environment Agency’s Climate Change Research Team and discussed the type of information required from scientists and the lag between new science and its incorporation into policy guidance.   Murray Dale from CH2M HILL demonstrated how this might practicably be achieved with results from a UK Water Industry Research Project which has taken the twin approach of using analogues from the new CONVEX rainfall observations and the very high resolution model output to provide new guidelines for UK sewer design under a changing climate.

A panel discussion examined how CONVEX and related science may be taken into the policy sphere, identifying potential avenues including the Climate Change Risk Assessment 2, National Adaptation Program, UKCPnext and UK water companies.  The day concluded by looking forward to exciting new initiatives, such as INTENSE, which is building on CONVEX to lead a global community examining changes in sub-daily rainfall.

fig2

Presentations from the day are available on the workshop webpage at http://research.ncl.ac.uk/convex/outputs/convex2015workshop/ along with three summary documents produced for the event providing details of key messages from the project, new climate change results and UKCP09 guidance in the light of the CONVEX findings.