The Premier League has started, as have our forecasts for it. Testing the model on 2016/17 and 2017/18 seasons suggested that on average we might expect to get about one correct score per week, and about 5 results right (i.e. we predict 2-0 and it finishes 2-1).
As you can see from our evaluation page for the Premier League, we got 3 correct scores, and six right results. While we’d like to think this will be the norm for the season, history tells us that this kind of a remarkable performance only happens about 1% of the time! We scored 100 points more than Mark Lawrenson by his scoring metric (10 points for a correct result, 40 for a correct score). In our testing, we only got a better score than Lawro about 35% of the time.
Looking down the divisions, we see a more subdued performance; in the Championship just 1 correct score, and four correct results, in League One no correct scores and just two correct results, and in League Two no correct scores and six correct results.
Why were our picks so much better in the Premier League? A few hypotheses. One is that there is a lower turnover of teams in the Premier League, with only three teams entering each season relative to six in the Championship, seven in League One, and six in League Two. Our performance this week supports this, since our worst forecast performance was in League One.
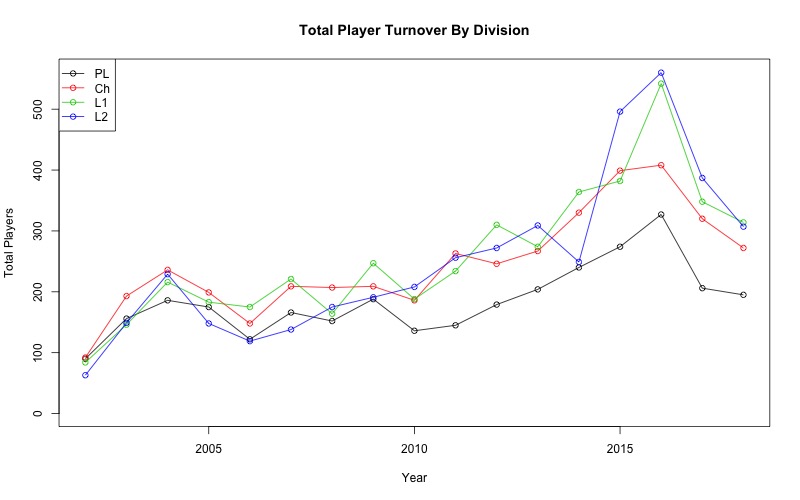
Another hypothesis is that lower league clubs rely more heavily on the loan system for players, and short-term contracts, and as such turnover is higher at these levels. Again, there’s some support for this. The plot below is the total turnover in players at football clubs in the summer months (data from Soccerbase). The blue and green lines are Leagues One and Two, and in recent years have been higher than the Premier League and Championship.
3 thoughts on “What a weekend!”