As part of their final practical session for the course MT11C Introduction to Weather and Climate, a group of first year undergraduate students conducted a synoptic analysis of the extra-tropical cyclone Friedhelm. This storm brought strong winds and disruption to Scotland and Northern England over the 8th and 9th December, 2011. You can read more about the research flight that some members of the department took through the storm as part of the DIAMET campaign here. The analysis was conducted in small groups by the students listed below, assisted by demonstrators Angus Ferraro, Kirsty Hanley and Kaah Menang

Surface synoptic development (Jon Baker, Sara Jackson and Liana Lucatniece)
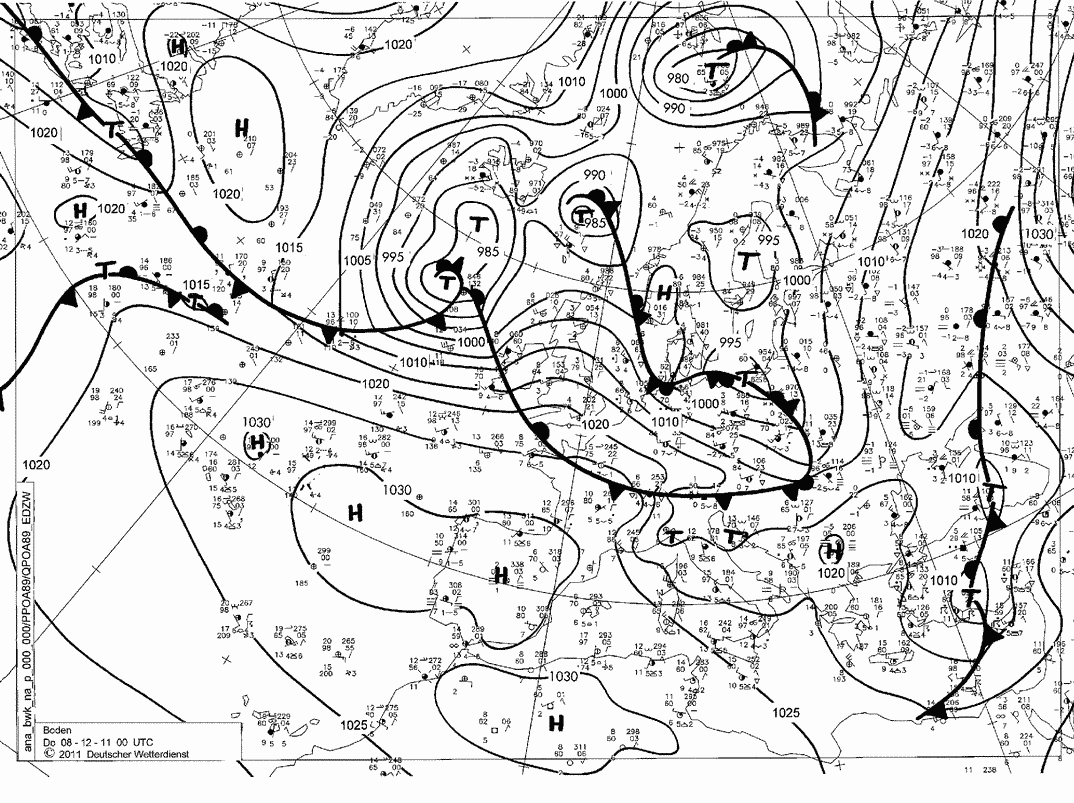
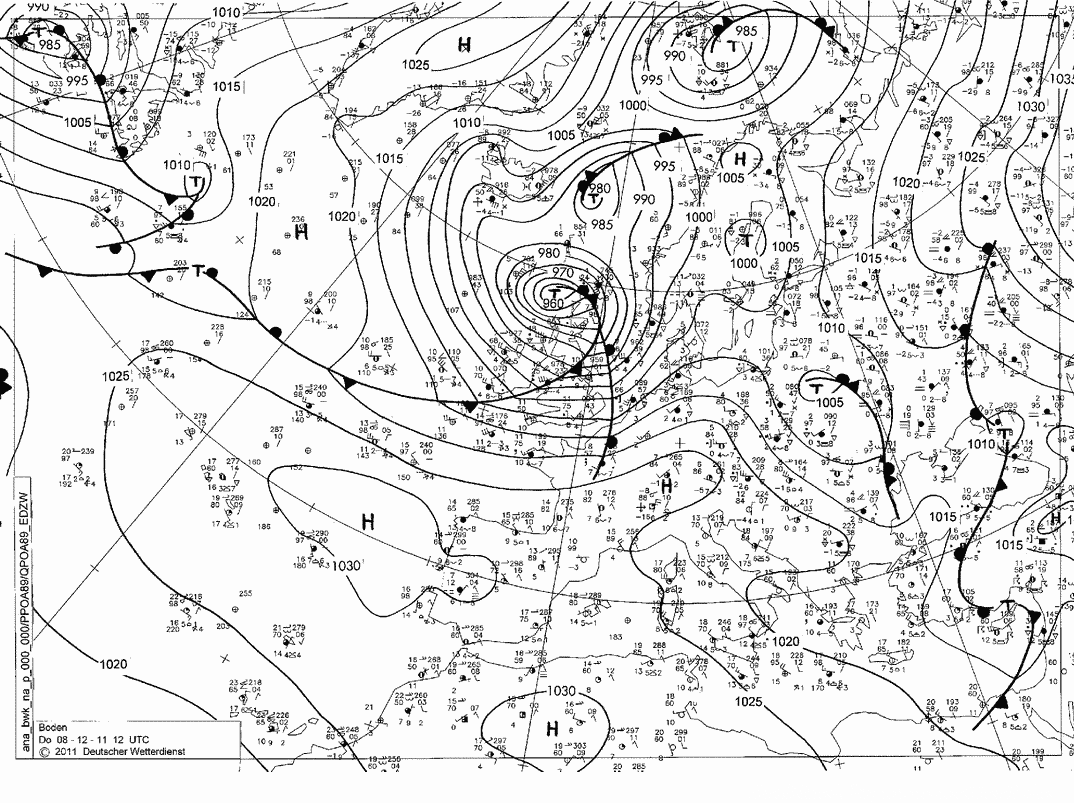
A strong surface low pressure system developed over the Atlantic to the north-west of the UK. The surface analysis shown below, at 00UTC on 8th December shows a system with a central low pressure of 985hPa. The system moved south-eastwards towards Northern Scotland and strengthened with central low pressures dropping by 20hPa to 965hPa by 06UTC. By 12UTC, the system developed further and moved over the tip of the UK. At this point the pressure reached it’s lowest analysed value of 960hPa, a deepening of 25hPa in 12 hours. The centre of the low pressure passed over the UK by 18UTC, however a significant region of high surface pressure gradient remained over the UK well into the 9th Decemeber, with very strong wind gusts (up to 165 knots) observed at Cairngorm in Northern Scotland.
00UTC Thursday 9th December
12UTC Thursday 8th December
Surface wind observations (Jonathan Beverley, Emma Camp and Amadou Jawara)
Analysis of the 12UTC surface weather reports showed that the areas with the strongest average winds and highest wind gusts were in southern and western Scotland. The maximum gust was over 70 knots and the highest average wind speed of 54 knots for the same station. The area of highest wind speed was to the south of the centre of the low and corresponded to the area on the surface pressure charts where the isobars were closely compressed giving a high pressure gradient. The gusts seen at 18UTC were still up to about 70 knots but were much less concentrated. This means that between 12UTC and 18UTC there were recurring gusts of around 70 knots which would have caused the damage to power lines that was seen.
Observed surface wind gusts 12UTC Thursday 8th December
Air Masses associated with the storm (Cassie Elswood, Jack Marshall, Luke Storer, Harriet Turner)
The weak high pressure to the south of the storm is associated with a flow of warm Tropical Maritime air into the warm sector of the cyclone. The warm air (with temperatures up to 14 degC) meets very dry, cold arctic maritime air at the surface cold front (temperatures in the cold air mass range from -2 degC to -17 degC). When this very cold air encounters a warm land surface it can lead to unstable conditions. There is also a flow of dry cold air over the occluded front. The causes the ice clouds at the occlusion to evaporate, creating a region of dense air and bringing very strong winds to the surface.
Schematic of surface features and air masses associated with storm
Fronts associated with the storm (Peter McAward, Ben Powrie and Jess Welford)
Five day forecasts of the storm showed snow as far south as Birmingham, however this did not happen; Scotland did see snow in the mountains but any snow that fell in England did not settle. Instead it fell as a mixture of rain and snow. The analysis thickness chart below, for 00Z on the 9th (about 12 hours after the frontal passage) showed that the relative position of the occluded front and the 528dm line was not conducive for snow ahead of the occlusion. This makes sense, because according to the Met Office analysis, the occlusion is a cold occlusion with the coldest air behind the surface front. Earlier forecasts showed the 528dm line behind the occlusion, leading to the forecast of snow. Later forecasts changed the position of the 528dm line, moving it further north ahead of the occlusion, more in line with the observed conditions.
UK Met Office thickness analysis for 00UTC Friday 9th December
Vertical structure of the storm and development (Martin Baumber, Ty Buckingham and Luke Poundall)
The cyclone followed well the standard textbook example. At 12UTC on December 8th, the surface low was situated in Northern Scotland, with the upper trough at 500hPa located to the west of the surface low. The upper low (or short-wave trough) shows a typical patern of convergence and divergence in relation to the upper-level jet stream. The region of divergence at 200hPa is directly above the surface low and is one of the reasons that the mid-latitude cyclone strengthens. At 500hPa, isotherms show strong cold advection behind the surface low, further acting to deepen the system. The radiosonde ascent from Castor Bay shows moist air up to around 650hPa with a cold dry region above, associated with the dry, cold airstream behind the surface cold front.
Analysed upper level structure at 200hPa (top) and 500hPa (bottom) 12UTC Thursday 8th December
Schematic showing vertical structure of Friedhelm
Forecast Validation (Ian Rollins, Matt Rout and Ed Williamson)
The Met Office forecast was accurate up to around 84 hours before the event on Thursday the 8th and Friday 9th Decemeber. The forecasts were accurate in positioning the surface low. The 120 hour forecast did not represent what acutually happened, but forecast skill at five days is typically limited. The 84 hour forecast for Friday predicted that the surface low would have a central pressure of 964hPa and the analysed value was 970hPa. The only major difference between the forecasts and the analysis charts is the placement of fronts, this could be due to limited observations of the surface fronts while the system was over the Atlantic.


