A remarkable event occurs each springtime in the Antarctic (Sept-Oct-Nov) lower stratosphere – a dramatic depletion of ozone in a period of just a few weeks.
It has not always been this way. Ozone amounts can be measured in many ways. One useful measure is the total number of ozone molecules above a square centimetre of the surface (“column ozone”) – this is reported in Dobson Units (DU), named after a pioneering stratospheric ozone researcher. The global average value is about 300 DU. The British Antarctic Survey (BAS) have routinely measured column ozone since the late 1950s at their base at Halley. Until the early 1980s, Antarctic ozone had a weak annual cycle, rising from about 300 DU in late spring to around 370 DU in early summer, before returning back to about 300 DU, with some year-to-year variation in these values.
In the late 1970s and early 1980s, springtime column ozone seemed to be falling year on year. By 1983, monthly mean values had fallen to less than 200 DU, one-third of “normal”. Was this just natural variability or was it to do with human activity? In 1985, three BAS scientists (Farman, Gardiner and Shanklin) published a landmark paper reporting this decline and proposing chemical reactions which implicated human activity as a cause. The paper ignited a huge scientific effort to understand the nature and causes of the ozone hole (as it was, by then, known). Analysis of NASA’s satellite data showed that the ozone hole was an Antarctic-wide phenomena; balloon-borne ozonesondes showed the ozone depletion to be concentrated in the lower stratosphere.
Theories for its cause abounded – from changes in the stratospheric winds to changes in chemical processes (due to both natural effects and human activity). Human activity was expected to cause ozone depletion. Stratospheric ozone is in a “dynamic equilibrium” being constantly created and destroyed by a set of chemical reactions (as well as being blown from the equator to the poles by stratospheric winds). From the 1970s onwards, it was realised that a number of additional chemicals could destroy ozone – importantly, human activity was increasing their concentrations. These chemicals included the chlorofluorcarbons (CFCs) which were widely used for both domestic and industrial purposes (in aerosol sprays, refrigerators, air conditioning …). Three pioneers of this early work (Crutzen, Molina and Rowland) received the 1995 Nobel Prize for Chemistry.
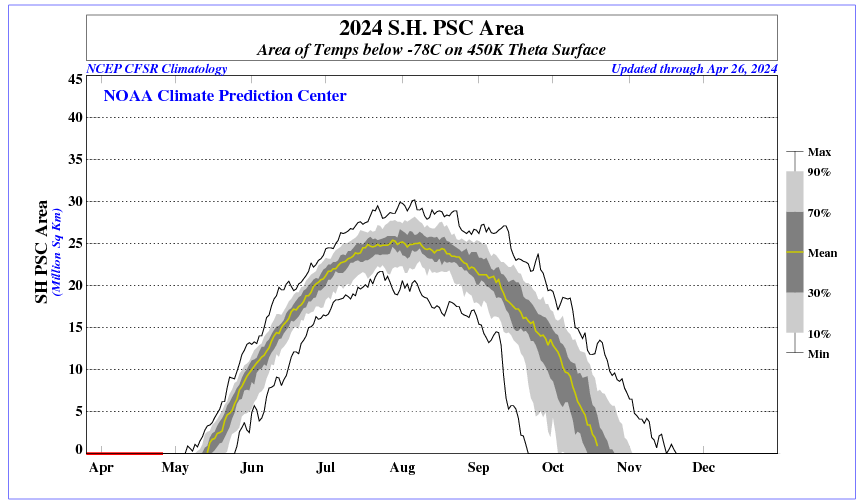
But there was a problem. This earlier ozone depletion theory did not predict the rapidity of ozone depletion (with about half of the column ozone being lost in a few weeks in the Antarctic spring), why it happened in the lower, rather than the middle and upper, stratosphere and why it occurred preferentially in the Antarctic. Airborne and ground-based measurements in the Antarctic quickly found a “smoking gun” which pointed to the role of chlorine released from the CFCs; lab measurements and theoretical work showed that hitherto unsuspected chemical reactions could rapidly deplete ozone. The key ingredients were as follows: during the winter darkness, the Antarctic lower stratosphere cools to very low temperatures (typically 190 K). Although the stratosphere is very dry, tenuous polar stratospheric clouds (PSCs) could form at such temperatures. Chemical reactions on the cloud particles released chlorine, which was normally locked up in a more inactive form, into a form that could “attack” ozone. These reactions needed sunlight, so it was only as the sun returned in the Antarctic spring that the final ingredient was in place.
The unique conditions in the Antarctic lower stratosphere were ideal for ozone depletion. Subsequently, a more modest global-ozone depletion was detected. The Arctic lower stratosphere is usually much warmer than the Antarctic in winter, so PSCs are rarer – nonetheless during occasional winter/springs, Arctic conditions are conducive to a less severe form of the ozone hole, as happened in 2011.
The political response to the overwhelming evidence of the human impact on the stratospheric ozone was swift, and has been hailed as one of the great successes of the United Nations. Under the Montreal Protocol on Substances that Deplete the Ozone Layer, and its subsequent adjustments and amendments, the emissions of CFCs have been reduced to almost zero. Because the CFCs are relatively stable molecules (having atmospheric lifetimes of typically 50-100 years), their atmospheric concentrations respond rather slowly to changes in emissions. Nevertheless, the concentrations of the major CFCs are now falling, in line with expectations.
Back in the Antarctic, the years following the ozone hole’s discovery saw ozone levels fall further as shown in the figure. This shows the October and December monthly-mean column ozone at Halley. The data is taken from Jonathan Shanklin’s BAS webpage using the monthly-means for 1957-2011 and the average of the daily-data for October 2012. Note that this 2012 daily data is still provisional, and subject to up to 10% adjustments following further analysis.
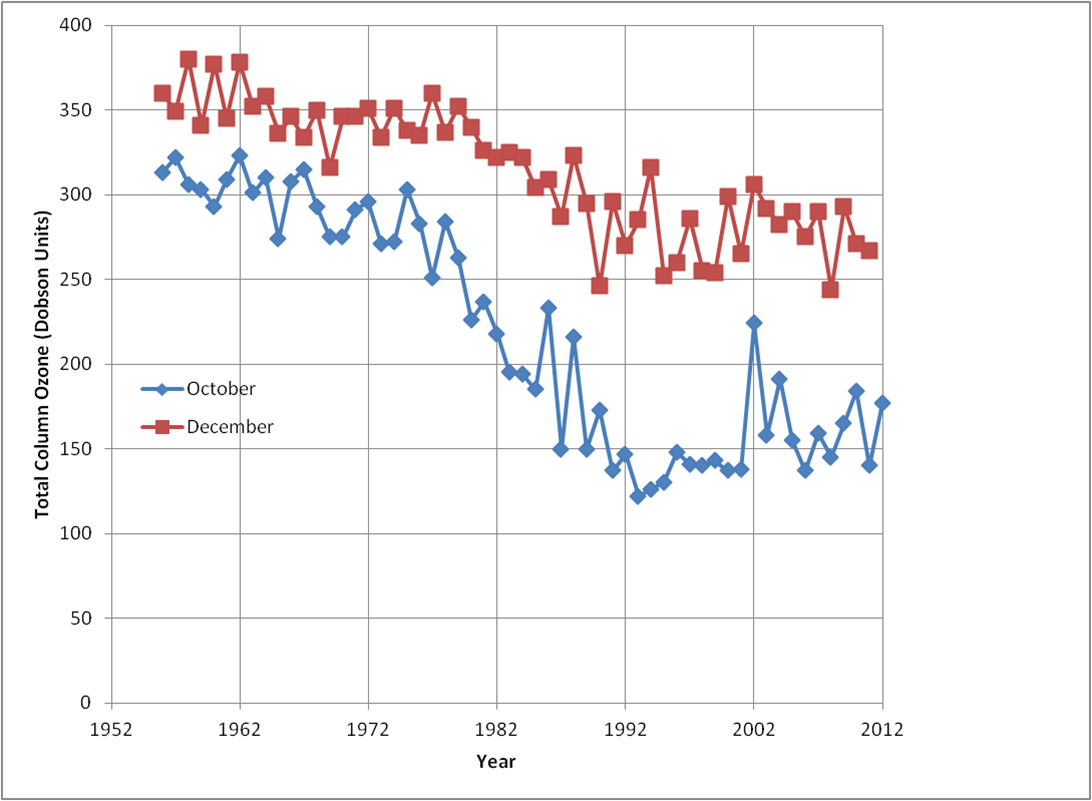
The figure shows that the ozone hole hit rock bottom in the early 1990s. This was partly because the amount of chlorine in the stratosphere was close to its peak. But it is also believed to be due the eruption of Mount Pinatubo, in the Philipines, which resulted in an increased number of stratospheric aerosol particles (tiny droplets of sulphuric acid) for a few years after the eruption. These enhanced the chemical reactions that released chlorine into its active form and deepened the ozone hole. The figure also shows that December values have remained depressed since the early 1980s, showing that a less severe ozone depletion persists beyond spring time
Since 2000, ozone amounts have been more variable – on average higher than the 1990s, but still only around half the values seen before the 1980s. 2012, on the provisional data shown in the figure, was one of the less deep ozone holes of recent times.
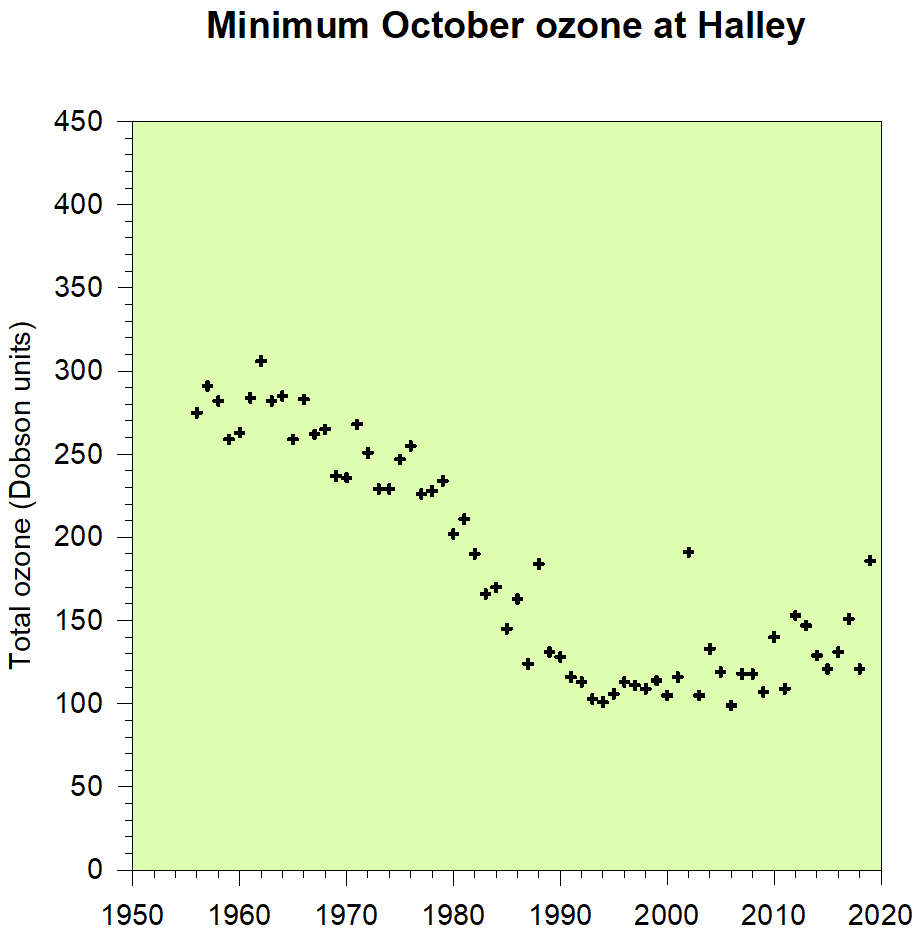
There are many ways that the ozone hole behaviour can be visualized. The Halley daily minimum each year (shown on Jonathan Shanklin’s webpage) seems to hint at a gradual recovery. Satellite data gives a more Antarctic-wide view. Animations of the 2012 hole show its dynamic nature (note the dark blue areas that develop during August), as it is influenced by the winds – on occasions, low ozone values sweep over populated areas of South America. Mixtures of satellite data and sophisticated atmospheric models also reveal large-scale features such as the Antarctic-wide ozone minima and the hole’s area (defined as the area with column ozone less than 220 Du). These plots consistently point to the 2012 ozone hole being less severe than in many recent years. During October 2012, temperatures were higher, and hence the amount of PSCs were lower, leading to less severe ozone depletion. Nevertheless, the strong ozone depletion in the lower stratosphere from late August onwards is clear in animations of ozonesonde observations made at the South Pole.
All things being equal, the expectation is that the ozone layer will continue to recover in years to come, as CFC concentrations decrease, but their long atmospheric lifetimes means that the ozone will not likely return to pre-1980s levels before about 2050. Continued monitoring of the ozone layer is necessary, as all things are not likely to be equal. First, ozone depletion could be affected if there were further large volcanic eruptions. Second, concentrations of some ozone depleting substances are rising. Third, climate change will lead to changes in stratospheric temperatures and winds, which could impact on ozone amounts.
Some Web Resources
Jonathan Shanklin’s BAS pages – a wonderful collection of up-to-date and archive material on Antarctic ozone depletion, at BAS stations and beyond.
NOAA’s Climate Prediction Center stratosphere pages
WMO’s Antarctic Ozone Bulletins
NOAA’s Earth System Research Laboratory ozone pages
The United Nations Environment Programme (UNEP) organises scientific assessments of the state of the ozone layer, the most recent in 2010. Its “20 questions and answers about the ozone layer” has much background information on ozone depletion. The UNEP website includes much useful information on the political and technological aspects of the response to ozone depletion.
Nature – a collection of some of the key papers in the “ozone story” brought together for the 25th anniversary of the Farman, Gardiner and Shanklin paper