Our evolving climate: communicating the effects of internal variability
[Part of an article to appear in ‘Weather’]
It is “very likely” that humans have caused most of the warming of the Earth’s climate since the mid-20th century; this was a key conclusion of the 4th Assessment Report (AR4; Solomon et al., 2007) of the Intergovernmental Panel on Climate Change (IPCC). For the UK, 2006 was the warmest year recorded to date, however 1998 remains the warmest year on record for the global average. This has led many to question whether the climate is changing as projected by the IPCC.
This article aims to portray and communicate the important role played by natural variability in our evolving climate. Understanding and acknowledging these variations is important for society and policymakers. Much of this variability is chaotic and unpredictable but some significant fraction is potentially predictable, providing an opportunity to narrow the uncertainty in climate predictions of the coming decade.
Our evolving climate
The Earth’s climate is changing primarily due to two factors – (i) the response to external forcings such as greenhouse gases, solar output and volcanoes, coupled with, (ii) the inherent internal (or natural) variability of the climate system. These natural fluctuations in climate can temporarily mask or enhance any long-term trends to the extent that one year, or even decade, will not necessarily be warmer (or wetter/drier) than the last.
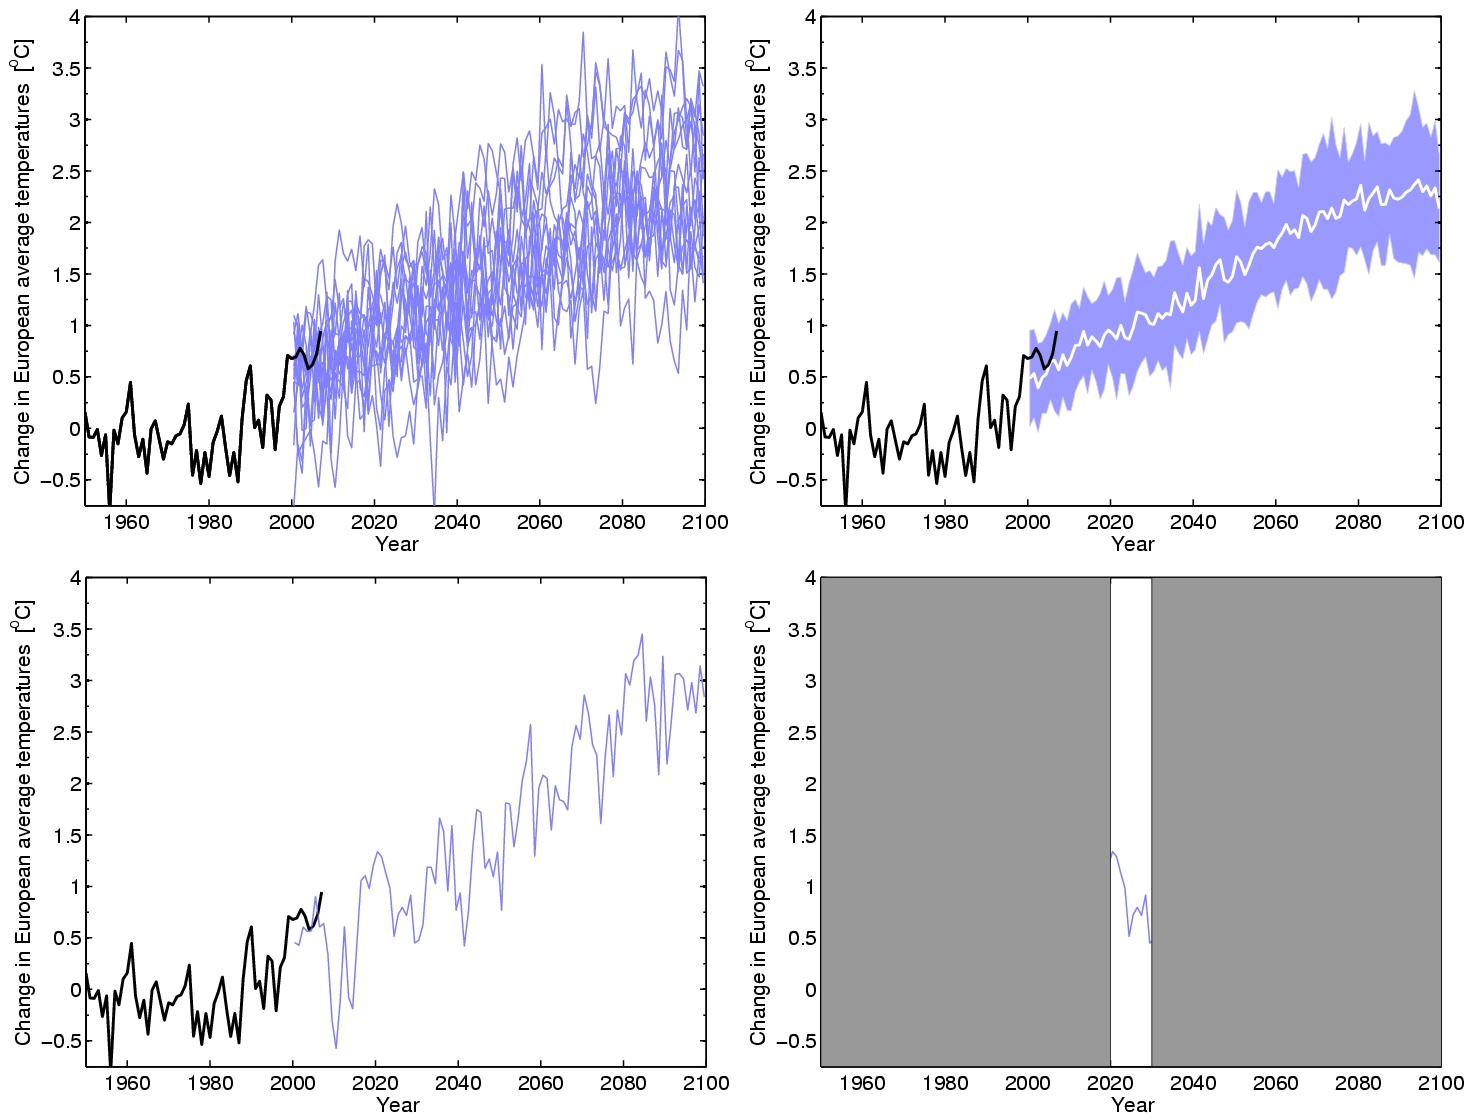
On seasonal and annual timescales, the main climate influence on global scales is the El Nino Southern Oscillation (ENSO) phenomenon – the periodic warming and cooling in the Pacific Ocean. It was the large El Nino in 1998 which helped produce the observed record global temperatures. Although ENSO has some impact in Europe (Ineson and Scaife, 2009), especially in winter, it does not dominate climate variability for the UK. Importantly, there are also longer decadal variations in climate, usually linked to changes in the ocean circulation. This type of natural decadal variability can make it difficult to distinguish between a long-term tend and a short-term natural fluctuation, illustrated for European (EU) temperatures in Fig. 1. The black lines in each panel show observed annual average EU temperatures from 1950 onwards. Temperatures have varied considerably from year-to-year, and decade-to-decade during this period of observations.
Various global climate models (GCMs), designed by different research centres around the world, predict climate assuming high, medium or low `scenarios’ of future greenhouse gas emissions. These GCMs all differ somewhat in their response to emissions, giving a range of `projections’ of how the climate will evolve through the coming century. For instance, the range of GCM responses for EU temperatures in the low emissions scenario indicate an increase in temperature between 1.5-3.5K (Fig. 1a, blue lines), i.e. there is some uncertainty in the magnitude of temperature change even when the same future emissions are assumed in each GCM projection. It is also clear that both the historical observations and temperature projections exhibit variability. However, when presenting this range of responses, the IPCC tends to show the average and spread of the GCM projections, indicating a relatively smooth increase in temperatures over the coming century (Fig. 1b, blue shading). Although this representation provides a range for the likely increase in future temperatures, it tends to disguise the natural variability of climate. One particular projection illustrating the impact of internal climate variability on EU temperatures is shown in Fig. 1c. To highlight the importance of the natural fluctuations in climate, a decade which shows a sharp decline in temperatures is then chosen from this particular projection (Fig. 1d), demonstrating how a climate trend may be misrepresented when considering a relatively short time period. Although this particular decade is chosen specifically, it is not unusual – there are also several periods of rapid warming and rapid cooling in the observational record.

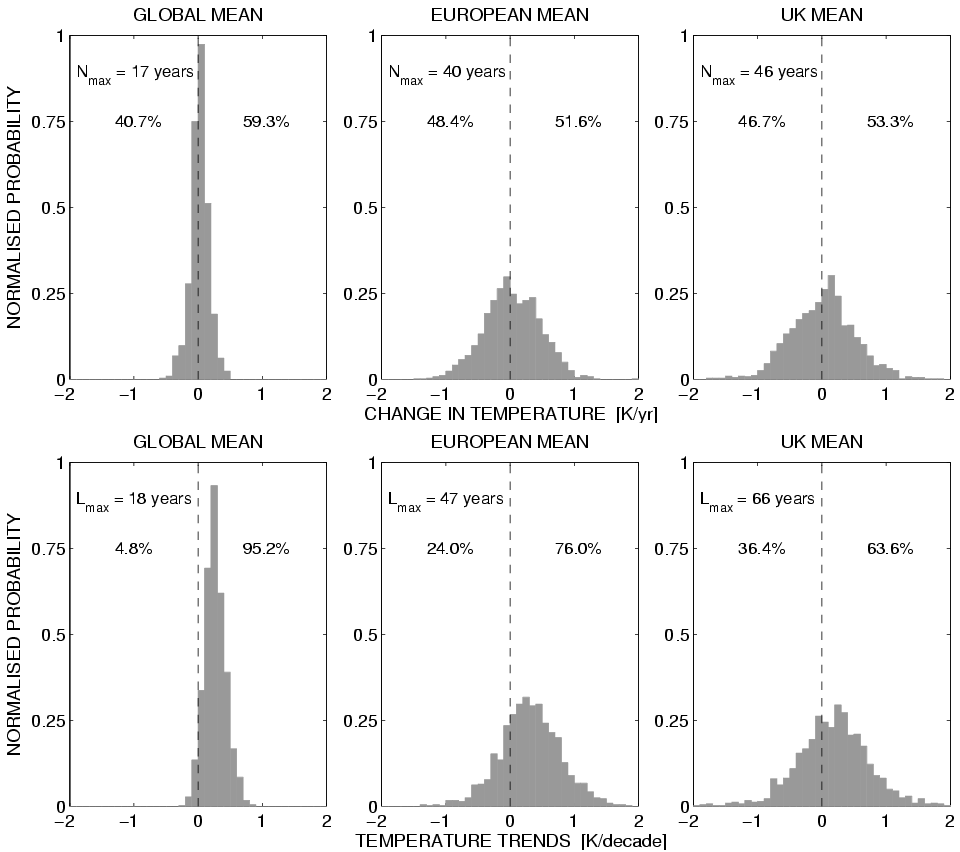
So, what is the chance of one year being cooler than the last? For global mean temperatures in the future, there is roughly a 40% chance that one year will be cooler than the last (Fig. 2a). Equivalently, this could be expressed as `2 in every 5′ years. For smaller regions, such as Europe or the UK, this chance is higher (around 47%). Although this may seem quite counter-intuitive, there is not much difference between the chances of a head or tails when tossing a coin, and whether the temperature in Europe one year will be warmer or cooler than the last.
However, for longer timescales the odds change because of the gradual upwards trend in temperatures. Decades which exhibit a cooling (or a negative temperature trend) are only expected occasionally in the future for the global mean (about 5% of decades), but these chances increase to 24% of future decades for Europe and 36% of future decades for the UK (Fig. 2b). Expressed as odds, there is roughly a 1-in-3 chance of a particular future decade exhibiting a cooling trend for the UK. This is a key point which is essential for society and policymakers to appreciate – temperatures are expected to (temporarily) go down as well as up, even in a warming climate.
Another interesting question to ask is, how long might we have to wait before a warmer year occurs? Although, we may be surprised that 1998 is still the warmest year recorded, the GCMs suggest that, for global mean temperature, it is possible that we could wait 17 years; and so far we have been waiting 12 years. For smaller regions, climate fluctuations are larger and for UK temperatures, we could wait nearly 50 years, although usually it would be under 5 years.
Although there are caveats to this simple analysis, it demonstrates how climate variability is likely to affect an individual’s interpretation of whether there are long term changes in climate or not. To determine whether the climate is truly changing, it is essential to consider long (multi-decadal) timescales and large spatial scales.
