Much has been written/spoken in recent weeks about the amount of rain that has fallen this winter (December-February) in southern England (and other regions) of the United Kingdom. But several other interesting facts appear to have been overlooked in the almost daily (at times) deluge of information above high winds, heavy rainfall, high tides and low pressure. Here I attempt to detail some of these from a Reading perspective.
I begin with a look back at the conditions in February and then at the winter as a whole. Finally I present a tongue-in-cheek look ahead at spring and summer, using an analogue forecasting approach.
The weather observations referred to here date back to 1908 when the forerunner of the University of Reading began climatological measurements at a campus off the London Road close to the town centre. In 1968 measurements were transferred to the cooler site at Whiteknights; this change needs to be remembered when examining long-period temperature records although the very small difference in rainfall statistics between the two sites can be safely ignored.
Conditions during February
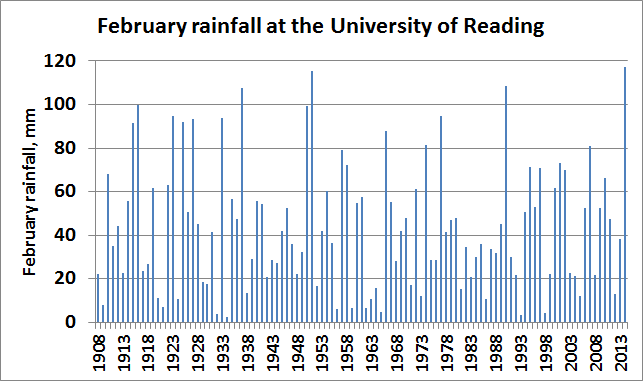
117.2 mm of precipitation fell in Reading during February, making it the wettest February on record at the University. It was only the fifth February since 1908 to record at least 100 mm, the total fall amounting to almost three times the normal February fall of 40.9 mm. 24.9 mm fell on 6 February, making this the fourth wettest February day in the Reading record.
This rainfall (no snow was recorded during February in Reading) was the result of a continuation of the passage of low pressure systems across the British Isles that had been experienced during the preceding six weeks. In fact the average mean sea level pressure at the University during February was just 997.6 mb – the lowest on record there for any month. Initial studies suggest that this value is lower by 1.1 mb than the lowest value recorded for any month in London’s records back to 1692 (Cornes et al., 2011). Typically the air pressure in London might be expected to be about 0.5 mb greater than that in Reading.
As a result of these generally cyclonic conditions, winds during the month blew from a southerly or south-westerly direction for much of the time. During the stormier interludes peak gusts reached 54 knots (62 mph) on the 14th with 40 knots (46 mph) being reached on four other days.
With winds from a mild south-westerly direction prevailing throughout the month, February was much milder than average. The average temperature overall of 6.9 °C was 2.1 degC above average making it the warmest February (along with 2011) since 2002.
Despite all the rain and associated cloud cover, February was a sunnier month than normal. The University’s sunshine recorded notched up a total sunshine duration of almost 99 hours, making it the sunniest February for six years.
Minimum air temperature in February
The lowest temperature recorded at the University during this February was a relatively balmy 1.3 °C on the 16th, meaning that Reading (along with much of southern England and East Anglia) was free of air frost this month. This was the warmest ‘coldest February night’ since 1.8 °C in 1961 (albeit this was at the slightly warmer London Road site). Only in 1961, 1966 and 1990 has February been free of air frost before this at the University. Normally in February we would expect the lowest minimum temperature to be -4.5 °C. There was, however, an air frost on 1 March.
Frost-free spells in winter
With Reading being air frost-free, how does this compare with other spells that failed to record an air frost at this time of year? The last day of February was the 31st consecutive day with temperatures remaining above 0 °C – spells of this length (and longer) have occurred during eight other winters in records at Whiteknights that date back to 1968; three of these have been since 2004 while at the slightly warmer site at London Road a remarkable 57-day spell ending 19 March 1966 was frost-free.
Wettest winters and seasons
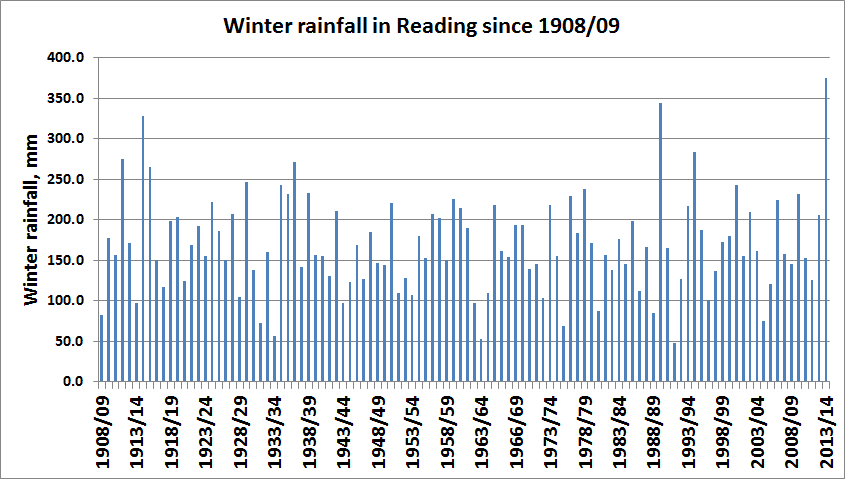
With 374.6 mm of rain falling this winter, it has been the wettest winter (and, indeed, season of any name) in the University’s rainfall record. Previously, the wettest winters had been those of 1914/15 (327.9 mm) and 1989/90 (344.6 mm) – these being the only winters to record over 300 mm of precipitation. The only seasons in which 350 mm or more precipitation had previously fallen were the autumns of 2000 (353.4 mm) and 1974 (352.2 mm). Much of this winter rain fell in just 11 weeks, and the winter’s fall represents 59 per cent of the annual average rainfall at the University.
‘5 mm+’ days
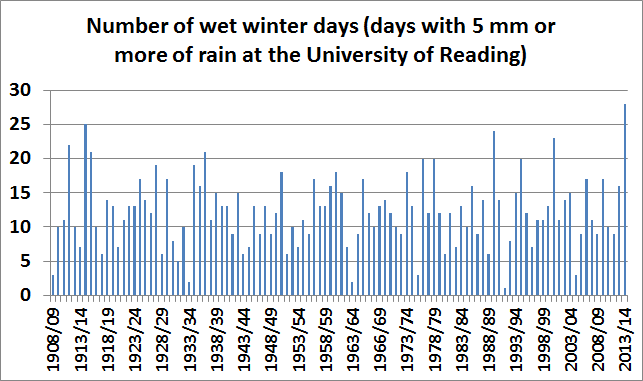
After a dry start to December (only 4.7 mm of rain fell during the first fortnight of the month) this winter’s rain has tended to fall frequently with moderately large daily totals, rather than being due to a few exceptionally wet days. The wettest day of the winter was a fall of 29 mm of rain fell on 23 December. However, the number of days when 5 mm or more of rain fell totalled 28 this winter – more than in any other winter in the University’s record. In fact only the only time when as many wet days occurred in three consecutive months was during October to December 1929 and November 1929 to January 1930 – both these periods also had 28 wet days.
Winter temperature and sunshine
Each month this winter was warmer than normal, with the average temperature for the season of 6.5 °C making it the mildest winter since 2005/6 when 7.0 °C was the average temperature. The lowest temperature recorded this winter was -3.8 °C on 12 January – this was the only morning when the air temperature reached -2 °C or lower.
Only in ten winters has the air temperature remained above -3.8 °C since 1908 – at the current (colder) Whiteknights site this has happened only in 1974 (when the lowest air temperature was -2.2 °C), 1988 (-3.1 °C) and 1997 (-3.4 °C).
The incidence of ground frost (when the temperature at grass tip level falls below 0 °C) was close to normal this winter. However, air frosts were infrequent throughout the winter – only on 10 mornings did the air temperature drop below 0 °C, the fewest occasions since just 8 mornings in 1989/90. The only other winters since 1908 to record fewer air frosts were those of 1960/61 and 1974/75 – both of these had 9 air frosts.
Only one day with slight sleet (during a short-lived shower) was observed at the University this winter. Although this incidence of snow/sleet is much less than during the previous five winters; in Reading it is not uncommon for winters to have just one or two days of snow – or indeed, to be free of any snowfall at all.
This winter has also been sunnier than average with 198 hours of sunshine being recorded – although this was not as sunny as in 2011/12.
Winter air pressure and winds
Air pressure this winter was been generally low after mid-December with frequent stormy spells in Reading. The average air pressure of 1004.7 mb was the lowest for a Reading winter since 1914/15 – which was also another very wet winter. The peak gust occurred on Christmas Eve in the current winter – when 76 mph was recorded.
Forecasts based on analogue conditions after previous wettest winters
While seasonal forecasts nowadays tend to be made using numerical weather prediction (i.e. by means of computer models of the atmosphere and ocean), before the advent of such models an analogue method was employed. This consisted of finding similar months/seasons to the ones that had just occurred and then examining the weather conditions that had followed these similar (i.e. analogue) months. This typically meant examining the large-scale flow atmospheric patterns as well as local (i.e. UK-wide) conditions.
The analogue method has a major drawback in that it is virtually impossible to find a perfect analogue pattern from the past. This is particularly true when recent conditions have been so extreme as to have fallen into the ‘wettest on record’ category (as in this winter) – implying such extreme conditions have not occurred previously in the instrumental record. In particular, an analogue forecast of seasonal UK weather should take into account conditions over much of the Northern Hemisphere, if not global conditions, over recent weeks.
Accepting this drawback, it is nevertheless interesting to examine what types of spring and summer weather have followed previous winters in Reading that have been this wet or mild.
During the 50-year period 1961-2010 out of 20 mild or very mild winters, 12 were followed by a mild or very mild spring and just two following springs were cool or very cool. As mentioned above the winter of 2005/6 was a mild winter – and the summer of 2006 was the warmest summer on record in Reading.
Prior to this year, by far the wettest winters since 1908 in Reading were those of 1914/15, 1989/90 and 1994/95. Each of these three winters listed above were followed by a dry or very dry spring.
- The spring of 1915 had two notable droughts when about 38 mm of rain fell in almost ten weeks from March to mid-May. Late May was a little wet but then June was dry and July turned wet.
- In the spring of 1990 just 39.2 mm of rain fell at the University making it the driest spring on record in Reading since 1908. The late summer of 1990 was hot (reaching 35.5 °C in August) and sunny and after February it was a very dry until December.
- August 1995 was hot and dry and the summer was generally a warm one. The period April to August was remarkably dry with just 3 mm of rain and almost 280 hours of sunshine in August made it the second sunniest August on record.
In addition, the winter of 2002/03 was another winter with lots of flooding locally around the start of January – and that had a hot, dry August with 30 °C reached on 10 days during the summer, including 36.4 °C on 10 August.
Maybe this is just nature’s way of saying that nothing lasts forever? But note also that there have of course, given the caveats mentioned above, been other very wet (but not quite as wet) winters locally after which the spring and summer months have not been so benign (for example the summer of 1877 when late May frosts in Berkshire created havoc with budding potato plants and only June was dry, and the spring/summer of 1912 when (after an almost totally dry April in east Berkshire) the summer was said to be one of the wettest for 50 years).
Fingers crossed then!
Acknowledgements
The daily weather observations during the current winter have been made, almost exclusively, by the University’s meteorological observer Mike Stroud.
References
Cornes, R. C., Jones, P. D., Briffa, K. R. and Osborn, T. J. (2011) A daily series of mean sea-level pressure for London, 1692-2007. International Journal of Climatology. doi: 10.1002/joc.2301