By Simon Rowell
We’re now well into the North Atlantic Hurricane Season (generally taken from 1 June to 30 November each year, with the busiest months usually August and September). When a tropical depression gets named it doesn’t necessarily mean it’s a hurricane (Beaufort Force 12 or above, 64 knots / 33 metres per second or more), as they are named once they reach gale force (Beaufort Force 8, 34 knots / 17 metres per second or more) – but it’s still rather un-nerving knowing that this large convective system possibly heading your way actually has an identity. For a tropical depression to spin up and develop into a hurricane there are a number of atmospheric criteria that need to be satisfied. Very briefly, these are: sea surface temperature greater than 26°C; a potentially unstable atmosphere; a moist mid-troposphere; low vertical wind shear; a location greater than ~ 500 km from the Equator; and a low to mid-level disturbance with enough vorticity to generate convergence. It is this last criteria that I’ve been investigating.
African easterly waves (AEWs) develop over West Africa in the mid-troposphere and propagate over the tropical Atlantic towards the Caribbean, and these are often the low to mid-level disturbances mentioned above that develop into North Atlantic hurricanes. The years 2005 and 2006 were contrasting seasons – 2005 had 31 named storms while 2006 only 10 – but a similar proportion of these originated as AEWs, around 70%. AEWs are troughs, normally aligned roughly N/S, and they can be tracked using one or both of two convective vortices. These two are generally on either side of the African Easterly Jet (AEJ), a jet found around the 600 hPa level which crosses the West African coast at about 10° to 15°N. The northern vortex is a low-level one caused by the strong heating effect of the Saharan land surface up to around 850 hPa, while the southern one is more of a cyclonic eddy developing on the Equatorwards side of the AEJ at around 600 hPa. Once over the Atlantic the northern vortex is advected towards the south-west by the Trade Winds, and by around 20°W they are usually combined. This vortex is used to track AEWs, and we’ve found that using a vertically-averaged relative vorticity (RV) from 850 hPa to 600 hPa is the most robust for this.
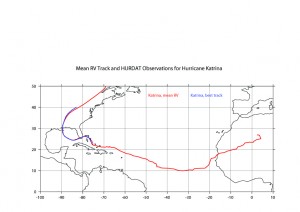
The red track in Figure 1 shows this vertically averaged RV track for the AEW that eventually became Hurricane Katrina in August 2005, and the blue one shows the official National Hurricane Center observations track for the centre of Katrina. There are two things that stand out here – firstly, the RV track (made from ERA-Interim reanalysis data) closely follows the actual observations, and secondly the AEW was tracked from the other side of the Prime Meridian.
Figure 1. The US National Hurricane Center’s observations of Hurricane Katrina in August 2005 (blue track) and the mean vertical RV from 850 hPa to 600 hPa from the AEW that developed into it (red track, ECMWF ERA-Interim reanalysis data)
What allows an individual AEW to develop, while one that crosses the West African coast a couple of days later doesn’t? We’ve made composites from developing and non-developing AEWs, and have found that the ones that do develop tend to have a warmer sea beneath them (with a distinct step at 27°C), they have a stronger AEJ to the north of them, they have a more humid troposphere from the AEJ upwards, and with that more vertical ascent, and they aren’t snuffed out by entrainment of dry Saharan air in the mid-levels from 700 hPa to 500 hPa. We’ve done initial comparison work between the ERA-Interim reanalysis set and the Met Office’s GloSEA5 seasonal forecast data with encouraging results on that timetable. By having a better understanding of what causes an individual AEW to develop or not we can hopefully give more advanced warning of potentially dangerous systems, both on a system-to-system and on a seasonal basis.

