By Roger Brugge
Statistics for Reading show that July was the eighth consecutive warmer-than-average month on campus, before August (average temperature 15.8 ⁰C) turned cool enough for the summer to be just 0.1 degC warmer than average. But summer was not finished – anticyclonic conditions in September led to quite a bit of cloud, a mean temperature that was some 1.1 degC above average and no rain from the 2nd to 17th inclusive (compensation perhaps for the August bank holiday washout). In fact September was only 0.1 degC cooler than August and the warmest September for three years.
Not surprisingly, during the past 12 months Reading’s average temperature has been a high 11.4 ⁰C – this is almost as warm as the year of 2011 (only 2006 has been warmer than that year locally).
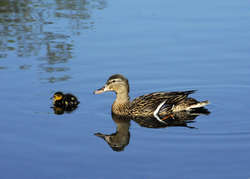
Figure 1. Ducks on Whiteknights Lake at the heart of the 130 hectare Whiteknights campus. © University of Reading
How has Reading’s rainfall total developed during the year? After a wet start (in fact the wet weather goes back into December 2013) the 2014 rainfall total stood at 269 mm by the end of February. With Reading’s average annual total being only 635 mm, and the wettest year in the University record (1903) having 961 mm, no doubt the ducks on Whiteknights lake were rubbing their wings (or should that be webbed feet?) in anticipation of a good year (for ducks, anyway). As of the end of September our Snowdon raingauge had collected 645 mm (just above the average for the year as a whole) meaning that an average fall in the final three months would give a total of 847 mm – a total surpassed only in 1951, 1927, 1915 and 1903.
With all this warmth and moisture, it may not be surprising to some that 2014 has also seen a return to the ‘good old days’ when thunderstorms were not a rare event in Reading. As of the end of last week we had been treated to 18 days with thunderstorms in Reading – the most since 23 days with thunder were observed in 1983 – with one or two of these storms causing local damage and disruption around Reading. In my youthful days when I first caught the ‘weather bug’ as a thunderstorm observer, Reading recorded at least 17 thunder days annually in each of 5 years during 1968-1974 – see Figure 2.
Figure 2. The annual count of the number of days when thunder was heard at the University of Reading, 1960-2014. The data for 2014 include only the first nine months of the year.
To put these figures into context, thunder was heard on an average 9 days per year during 1981-2010. The months with the most thunder days during 1908-2013 were those of May 1969 (11 days) with each of May 1924, May 1967, June 1963 and July 1925 having 7 days on which thunder was heard.
The number of days with thunder during the year in the period 1908-2013 has ranged from 23 days in 1974, 1983 and 20 days in 1936 and 1969, to 2 days in 1915 and 1985, 3 days in 1909, 1986 and 2011.


