Typing “Arctic sea ice loss” into your web search engine will quickly reveal two things: a lot of people have written about the loss of ice; and there is a remarkable amount of commentary on what it implies. The complexity of internal variability in the climate, questions of the veracity and utility of models, and uncertainty in the evidence itself allows many an armchair commentator to selectively quote statistics to rationalise a particular view point. Depending upon one’s predisposition one can find evidence supporting the end of days (from a number of doom-laden scenarios) or of conspiracy (expressed from various viewpoints), among some more moderate views.
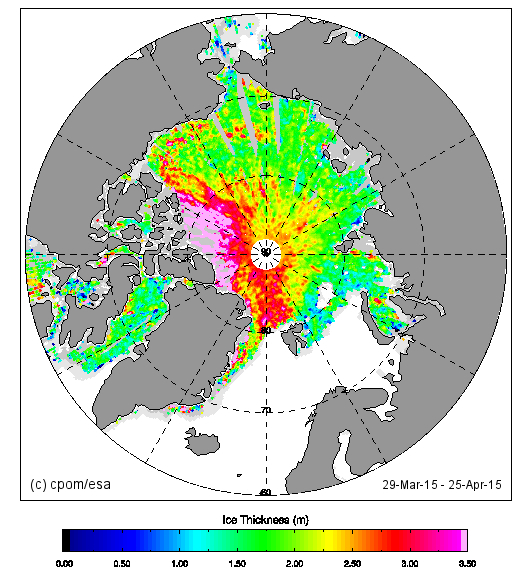
One of the reasons for uncertainty in interpreting loss of sea ice has been that satellite records have, until relatively recently, only reliably shown sea ice area. This is a problem as the same volume of ice can be spread out by the wind to cover a large area or it can be piled up to cover a small area. Reliable and wide-spread thickness data has been the holy grail of observational sea ice science for some time. The Centre for Polar Observation and Modelling has been using radar altimetry to obtain winter sea ice thickness estimates for about a decade (most notably work by the sadly departed Prof. Laxon). But in the last couple of weeks, this thickness data has been released as a thickness product available to anyone, see Figure 1. The public release has already attracted huge interest. Discussion of the data and how it is obtained is described by Jonathan Amos of the BBC.
Figure 1. CryoSat Operational Polar Monitoring, 28 day sea ice quick look product.
Of course, uncertainty about how to interpret Arctic sea ice loss and what it means for the future has been affected by the widely-held view that climate models have generally done a rather poor job of explaining or predicting the loss of Arctic ice. (The situation is considerably worse down south.) The loss of Arctic ice and also the ability to assess models with thickness data has given extra impetus to efforts at improving the physical basis of sea ice models. This year’s European Geosciences Union (EGU) conference in Vienna revealed some interesting examples of how improved models of sea ice physics can alter important simulation results, and I highlight just one example.
Dr Torge Martin, of the Helmholtz Centre for Ocean Research (GEOMAR) in Kiel, talked about how the atmosphere to ocean momentum transport in the Arctic Ocean has changed over the past couple of decades. Since sea ice is a rougher surface than the open ocean surface, the momentum transport from the wind to ice is more efficient than that to the open ocean. However, the momentum transport from the ice to the ocean relies on the relative motion of the ice to the ocean surface layers, and ice forces may resist the wind forcing. Torge’s calculations suggest there is an optimal ice concentration for maximum transport of momentum from the atmosphere to the ocean, of around 80% (Martin et al., 2014).
Torge’s projections using standard climate model treatments of the atmosphere, sea ice and ocean, presented at EGU, indicated an enhanced annual mean momentum transport from the air to the ocean in the coming decades. In the summer season, the vast sea ice area loss results in reduced momentum influx into the Arctic Ocean whereas during the remainder of the year decreasing ice forces enable greater momentum transfer. Thus, one might expect a stronger Beaufort Gyre and accumulation of freshwater in a surface lens.
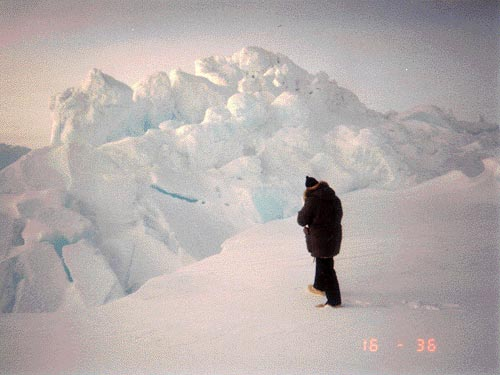
However, inclusion of a more realistic model of sea ice roughness [originating in our department, Tsamados et al., 2014], that accounts for form drag from discrete obstacles in the sea ice surface such as floe edges and pressure ridges (Figure 2), resulted in the opposite trend, with the conclusion that the coming decades will see a weaker Arctic gyre, with the possible loss of surface freshwater from the Arctic to lower latitudes, where it would be expected to affect dense water mass formation.
Figure 2. “Pressure ridge – where two ice floes meet” Photo courtesy of Ben Holt and Susan Digby.
The impact of sea ice form drag on sea ice and the Arctic Ocean is an active research area in the department, with a new project about to start with Danny Feltham.
References
Martin, T., M. Steele, and J. Zhang, 2014, Seasonality and long-term trend of Arctic Ocean surface stress in a model, J. Geophys. Res. Oceans, 119, 1723-1738, doi:10.1002/2013JC009425
Tsamados, M., D. L. Feltham, D. Schroeder, D. Flocco, S. L. Farrell, N. Kurtz, S. W. Laxon, and S. Bacon, 2014: Impact of Variable Atmospheric and Oceanic Form Drag on Simulations of Arctic Sea Ice. J. Phys. Oceanogr, 44, 1329–1353, doi:10.1175/JPO-D-13-0215.1


