By Alison Cobb
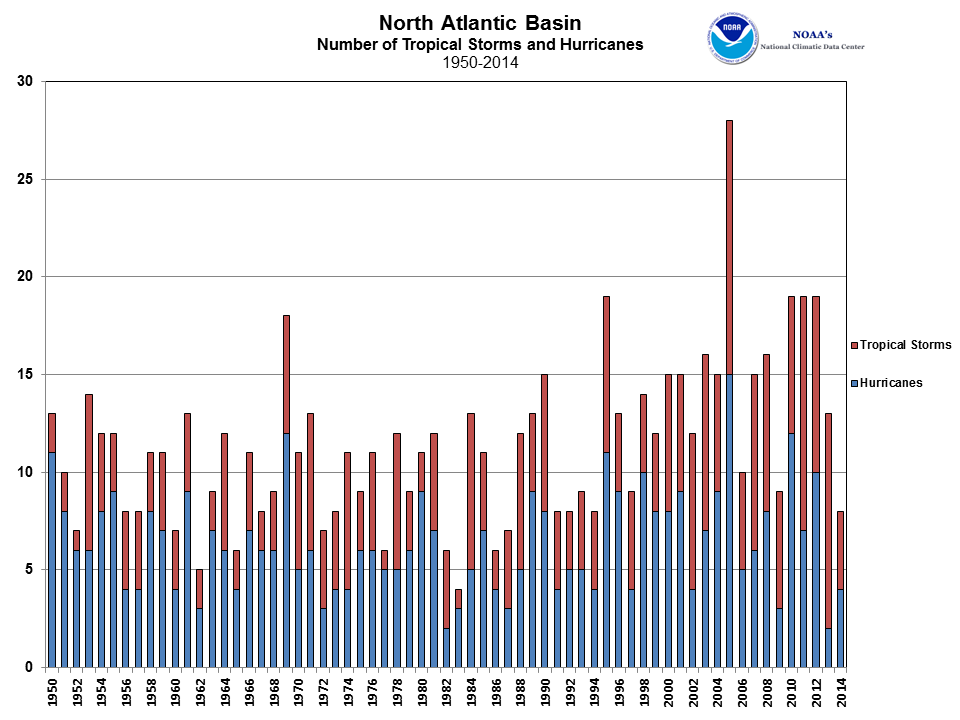
Extreme weather events, including (amongst others) tropical cyclones, can lead to huge socio-economic losses. The insurance industry, and risk management in general, is particularly sensitive to weather-related catastrophic events, and the impact of climate variability and climate change on extreme weather events is of great concern. For instance, Hurricane Katrina, which struck New Orleans in 2005, resulted in over $300 billion of damage. In the same hurricane season, a total of 14 major hurricanes were observed, which was considered exceptional. The question about the exceptionality of 2005 remains open. The large variability seen in the number of storms in the Atlantic over a 60 year period is shown in Figure 1.
Figure 1. North Atlantic storm counts from observations (1950-2014)
Extreme weather events (EWEs) are responsible for over 75% of insured losses, and the rate of total annual loss is apparently increasing. Figure 2 highlights the year-to-year variability in losses from catastrophic events. In most years, weather-related (meteorological) events are the greatest contribution to the annual loss. The trend has been for increasing losses with time, but with a huge amount of variability. There is even larger uncertainty about the past, for which we have little data on extreme events, and the future, which is influenced by anthropogenic climate change. The latest IPCC report (2013) still reflects major uncertainty about expected changes.
Figure 2. Insured catastrophe losses (1970-2014)
Catastrophe models are risk assessment tools used to estimate the possible financial loss due to a particular hazard. These models provide loss estimates by overlaying the properties at risk with the potential natural hazard (e.g. tropical cyclone track). A probabilistic approach to catastrophe loss analysis is the most appropriate way to handle the abundant sources of uncertainty inherent in all natural hazard related phenomena. The traditional stochastic approach used in catastrophe models by industry assumes that the climate is a stationary system. In fact, the climate system is non-stationary, displaying variability on multiple scales, which is shown to have an impact of extreme weather activity, such as tropical cyclones. Tropical cyclone activity is quite anomalous, for instance, in years of El Niño, or in years of La Niña.
Over the past ten years, the University of Reading have developed world-leading high-resolution global climate model (GCM) capabilities. GCMs are physically based models that produce a vast amount of climate data across the globe and can now be run at resolutions comparable to those which are used to produce weather forecasts. At these high resolutions, GCMs are able to simulate tropical cyclones as well as global modes of variability, such as El Niño. The University of Reading also has access to a well-known and well-respected tracking algorithm, TRACK. This algorithm can be run on GCM data to identify and extract tropical cyclone tracks, along with associated data such as wind speed and central pressure. Figure 3 shows the number of storms in the Atlantic over 150 years produced by HiGEM, a high-resolution GCM. This model reproduces well the long-term variability that has been seen in observations (Figure 1).
Figure 3. Atlantic storm counts simulated in the HiGEM high resolution GCM (150 years)
Retrospective-analyses (or reanalyses) integrate observations with numerical models to produce a temporally and spatially consistent synthesis of variables not easily observed. The breadth of variables, as well as observational influence, makes reanalyses ideal for investigating climate variability. Reanalyses contain data at grid points around the globe, making for ease of comparability to GCM data, and is a close representation to the ‘truth’ due to the constraint on the model evolution by the observations. The reanalysis datasets are tracked with the same algorithm as the GCMs, and within both sets of tracks, sub-samples of those within different climate states can be selected.
We are beginning to investigate ways in which these extreme event simulations from GCMs and reanalyses could be used as a basis for the hazard in catastrophe models, instead of relying primarily on historical data. With this large sample of historic, reanalysis and GCM tracks and augmented sample size, we can investigate interannual variability, such as El Niño / La Niña, and can come to robust conclusions. Complementing historic tracks with these new data offers the perspective of long-term climate variability and the ability to experiment with different future scenarios. This approach must be combined with rigorous assessment of GCM skill.


