
Understanding climate variability on regional and global scales has always been a challenge. The year-to-year and long-term variations in climate are consistently linked to tropical oceans, spanning the region between 23.5°S and 23.5°N. However, the influence of the subtropical and mid-latitude oceans in the Southern Hemisphere (the region between 55°S and 20°S, often referred to as the subtropical) has drawn more attention in the 21st century. The state of the southern subtropical oceans is intrinsically linked to precipitation and temperatures in the region, impacting agriculture, economies, and people’s well-being. The sea surface temperatures (SSTs) of the southern subtropics play a key role, influencing regional rainfall and global climate patterns like El Niño-Southern Oscillation and the Indian Ocean Dipole, as well as the Indian Summer Monsoon. They can affect global weather extremes and more, including the climate and weather of the Antarctic. However, our understanding of the drivers (or mechanisms) of subtropical SST variability, and associated events witnessed recently is still lacking.
Unknown links of climate events:
- South African flood in January 2013 linked to wavenumber-4 pattern in the atmosphere
- Tasman Sea heatwaves and cool spells associated with oceanic and atmospheric wavenumber-4 pattern
- Australian heat waves occur due to a wavenumber-4 atmospheric/oceanic wave
- Atmospheric wavenumber-4 pattern influencing the co-variability of subtropical dipoles in the Indian-Atlantic basin
- A wavenumber-4 pattern is often seen in SST anomalies over the subtropical Southern Hemisphere (during 1992, 1995, 1998, 2006, 2007).
Generally, a wave is a disturbance that travels through a medium, transferring energy without transporting matter. Both the ocean and the atmosphere possess waves. The wavenumer-4 pattern (W4) refers to four positive loading centres located in the South-central Pacific, South-western Atlantic, South-western Indian Ocean, and South of Australia and negative loading centres South-eastern Pacific, South-eastern Atlantic, South-eastern Indian Ocean, and South-western Pacific Ocean. These are observed in pressure, SSTs, and other physical variables across longitudes. For example, SST wavenumber-4 pattern looks like Figure 1.
Understanding this new oceanic/atmospheric pattern can enhance worldwide weather and climate forecasts, especially for the long term.

Figure 1: SST Wavenumber-4 pattern in the Southern Hemisphere.
How does it generate in SST?
The southern subtropics witness a stationary zonal wavenumber-4 pattern in SST anomalies (a deviation from the normal) during the austral summer (December-February), as seen in Figure 1. Prior to the evolution of SST pattern, a similar pattern generates in the atmosphere first. So, let’s discuss about the atmospheric W4 first.
In essence, the atmospheric W4 pattern responds to warm SST over the southwestern subtropical Pacific (hereafter SWSP) region. This warming effect extends to the air above, fostering upward motion as lighter air rises. With decreasing pressure at higher altitudes, the air cools, initiating condensation and rainfall, releasing heat into the surrounding atmosphere. The localized heating propels the wind south-eastward at higher altitudes, creating a disturbance.
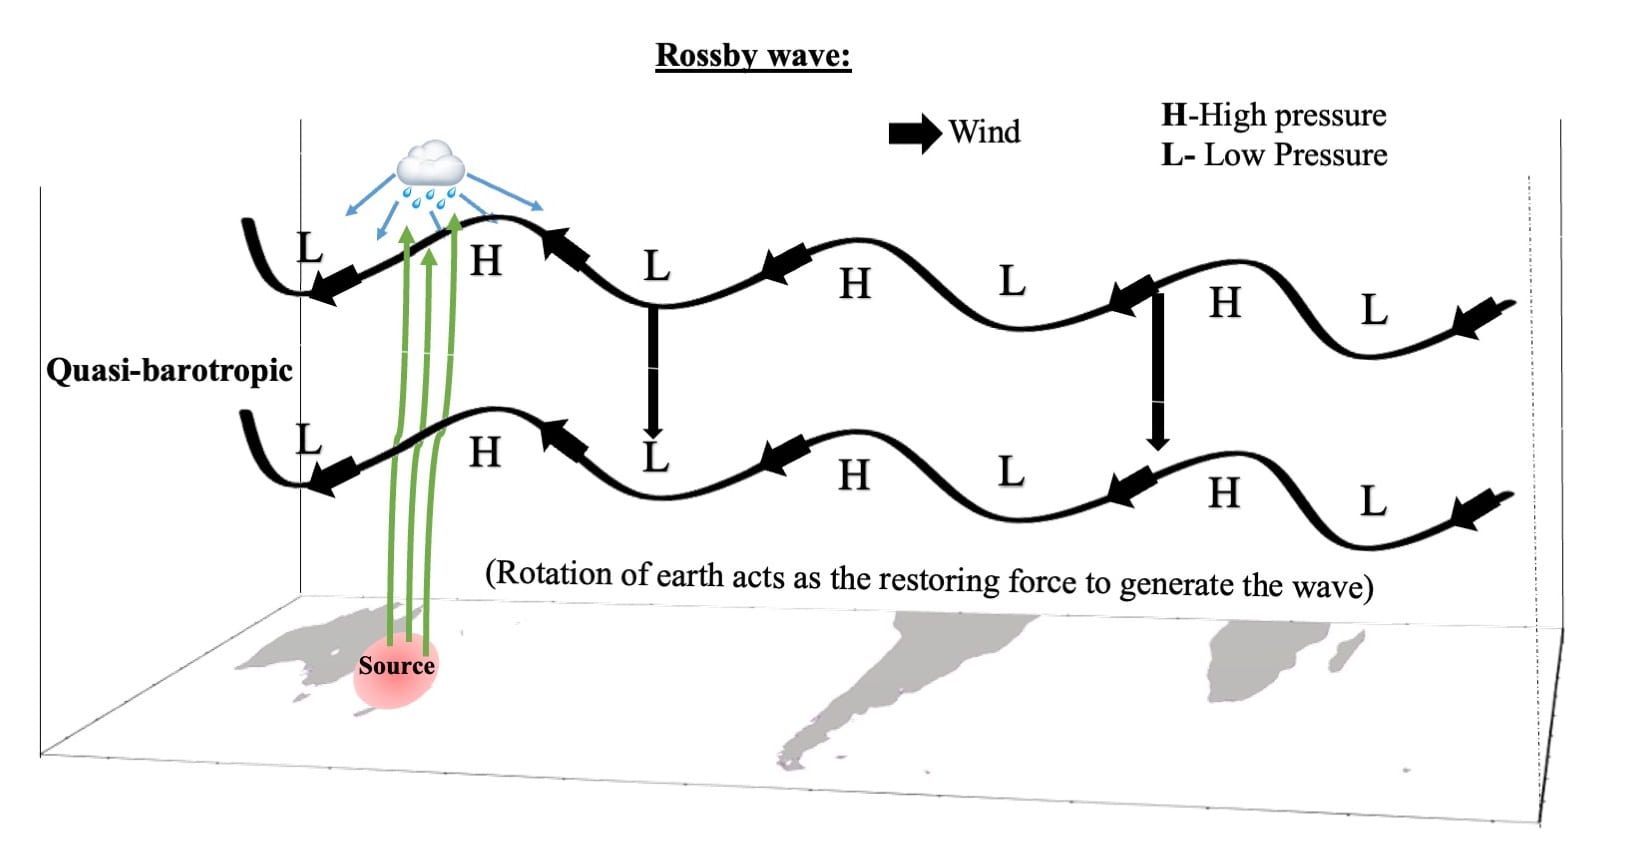
Figure 2: Illustration of the generation of the atmospheric W4 pattern. Warm SST over the SWSP force local air to rise and diverge in the upper atmosphere. This air, entrapped in the wave guide/jet, circumnavigates the entire globe, forming the atmospheric W4 pattern in the subsequent months.
The Earth has multiple jet streams – fast flowing, narrow air currents – one of which lies in the southern subtropics. It is useful to initially envision these as a closed chain of fluid parcels aligned along a latitude circle. As the disturbance (generated due to local heating) continuously propels this chain south-eastward over the SWSP region, the air current heads poleward. Earth’s rotation, however, compels the air current to return towards the equator, conserving angular momentum and hindering its poleward progress. Following this, it overshoots the normal latitude and eventually moves towards the equator. Over time, an undulation forms in the jet stream. The unbounded westerlies in the southern subtropics serve as a wave guide, allowing this signal to travel globally. Upon the disturbance’s arrival near the subtropical westerly jet, it becomes entrapped in the wave guide, circumnavigating the entire globe in subsequent months (refer to Figure 2). Consequently, an anomalous atmospheric barotropic wavenumber-4 pattern emerges by December (refer to Video 1).
Video 1: Evolution of atmospheric W4. Composite of daily geopotential height anomaly (filled in meter) and wind anomaly (vector in m s-1) at 250 hPa during Positive years.
Hereafter, the atmosphere kicks the ocean to form a corresponding SST pattern through mechanisms involving to meridional wind-evaporation-SST and/or meridional wind-evaporation-mixed layer-SST.
Variation in wind cause evaporative cooling to deviate from the normal values. For instance, wind can either enhance or supress evaporation, resulting in a cooler or warmer sea surface. This cooling effect, driven by wind-induced evaporation, can influence the pattern of sea surface temperatures and is known as the wind-evaporation-SST mechanism (it is essentially a mechanically driven mechanism).
However, the meridional wind can transport warm and moist (or cool and dry) air moving from the equator (pole). This process creates humidity differences at the air-sea interface, either facilitating or suppressing evaporation. SST become Cool/warm due to more/less evaporation than usual following the meridional wind, referred to here as the meridional wind-evaporation-SST mechanism. This mechanism proves to be valuable in generating the SST-W4 pattern (see Figure 3).
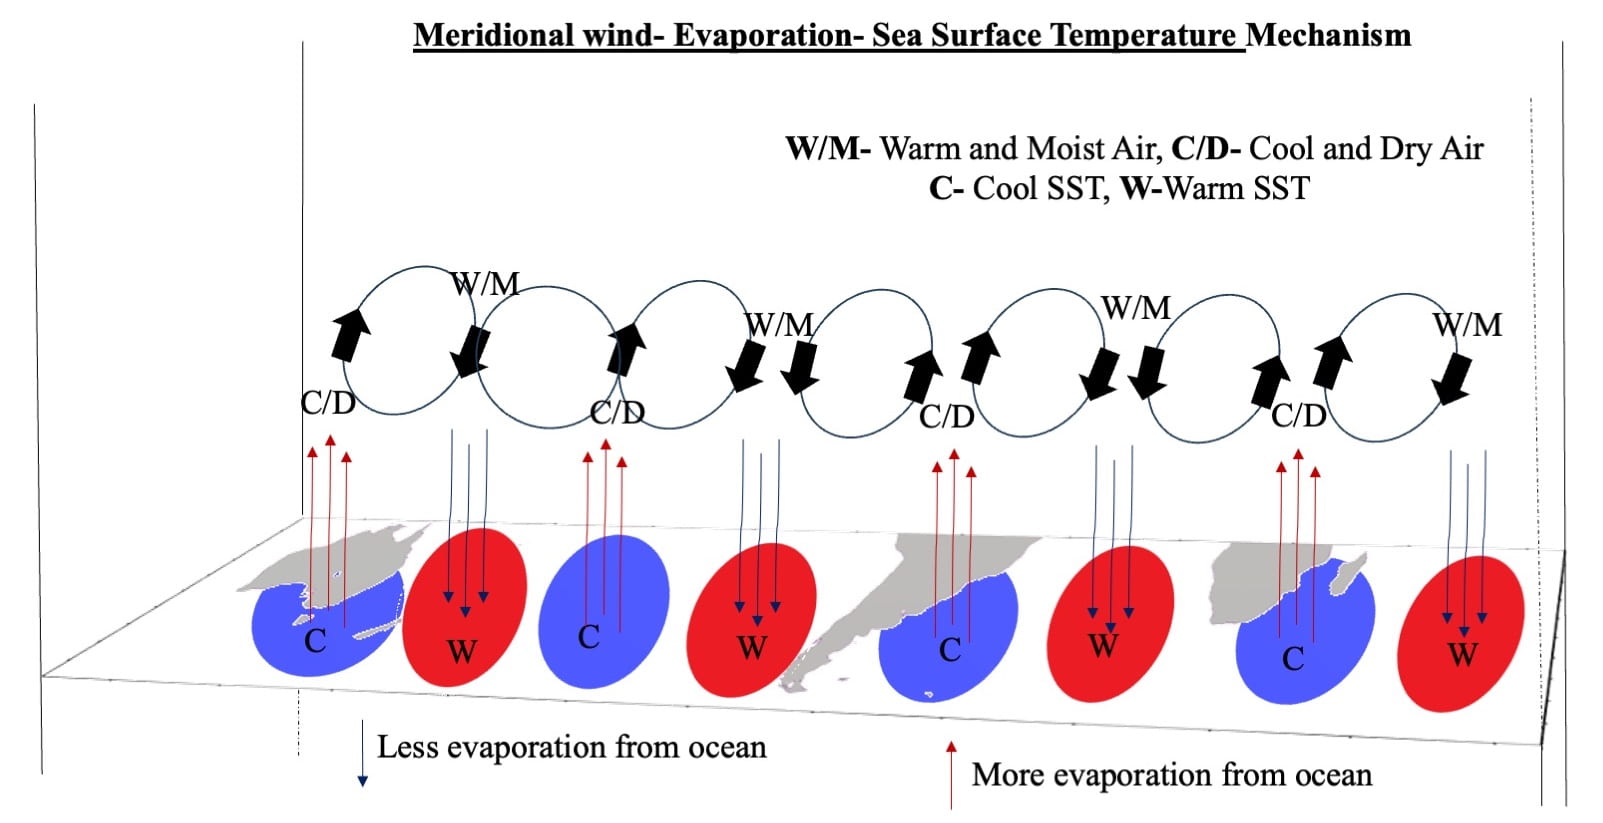
Figure 3: Illustration of the Meridional Wind-Evaporation-SST Mechanism. Sequences for understanding: (1) Air circulation – warm and moist (or cool and dry) air moving from the equator (pole). (2) Differences in humidity at the air-sea interface, either facilitating or suppressing evaporation. (3) Sea surface temperature variations due to more or less evaporation than usual.
A layer in the upper ocean with relatively homogenous values (such as temperature or density) is called a well-mixed, or more commonly, a mixed layer. It is mostly generated by winds, surface heat fluxes, or processes such as evaporation or sea ice formation, which result in an increase in salinity. Following the humidity difference at the air-sea interface, less/more evaporation suppresses/enhances mixing in the upper ocean due to lighter/heavier surface water compared to the water below (referred to as negative/positive buoyancy). Then, a constant solar energy distribution in less/more volume of upper ocean mixed water generates warm/cool sea surface temperatures (see Figure 4).

Figure 4: Illustration of the Meridional Wind-Evaporation- Mixed Layer- SST Mechanism. Sequences for understanding: (1) Air circulation: warm and moist (cool and dry) air movement from equator (Pole). (2) Humidity difference between at the air-sea interface facilitating/suppressing evaporation. (3) less/more evaporation suppresses/enhances mixing in the upper ocean due to light/heavy surface water compared to the water below (called negative/positive buoyancy). (4) Constant solar energy distribution in less/more volume of upper ocean mixed water generates warm/cool sea surface temperature.
However, the atmosphere is unable to maintain the signal after a few months over the region. In this context, the MLD-SST feedback processes come into play, extending the duration of the pattern until April-May, because of memory of the ocean.
Long term variability of SST-W4 pattern:
Apart from year-to-year variation, this W4 pattern also exhibits a decadal cycle. The primary reason behind this is closely linked to the decadal variation of the South Pacific Meridional Mode (SPMM). When the SPMM decays, it leaves behind some SST signals over the South Pacific Ocean, particularly in the SWSP region, which persist for an extended period. Due to this SST anomaly over SWSP, the entire mechanism repeats, leading to the SST-W4 pattern having more positive/negative events in one decade compared to the next/previous. The decadal variation in rainfall over Southern Continents, associated with the decadal variability of the SST-W4 pattern (explained in the next section), adds an extra dimension to understanding the source of regional SST anomalies and their impact on rainfall.
Southern Continental rainfall controlled by wavenumber-4 pattern:
Since the SST-W4 pattern covers the globe, it potentially influences decadal rainfall variability over Southern Continents by modulating local atmospheric circulation. Anomalous SSTs near South America, Australia, and Southern Africa force the wind to move on-/offshore and converge/diverge the moisture into/out of the landmass. As a result, specific humidity changes and alters rainfall over Southern Continents on a decadal timescale. A similar process is also observed on the inter-annual timescale, impacting Australian rainfall (refer to Figure 5).

Figure 5: Illustration of the impact of SST-W4 on Australian rainfall on an inter-annual scale. Anomalous SSTs close to Australia force the wind to move on-/offshore, converging/diverging moisture into/out of the landmass. As a result, specific humidity changes and alter the rainfall.
The atmospheric W4 pattern also significantly impacts precipitation patterns in South America and Australia through upper-level divergence, influencing descending and ascending air motions, and subsequently affecting regional rainfall. The complete story of the wavenumber-4 pattern is illustrated in Figure 6.

Figure 6: Schematic illustration of the various mechanisms involved in the growth and decay of SST and atmospheric W4 pattern on both inter-annual and decadal time scales, along with their teleconnections to Southern Continental rainfall.
Future Perspectives:
Given its worldwide climate influence as a new mode, there is ample room for extensive future research. The interaction of SST and atmospheric wavenumber-4 with the south Indian-Atlantic wave, mid-tropospheric semi-permanent anticyclones, Southern Annular Mode, Pacific South American Patterns, subtropical highs, marine heatwaves/cold surges are still unknown. Southern subtropical SST variability has the potential to impact both tropical and the climate of Antarctica. The role of SST and atmospheric W4 in the extra-subtropical region are open for future studies.
Further reading:
Senapati, B., Dash, M. K., & Behera, S. K. (2021). Global wave number-4 pattern in the southern subtropical sea surface temperature. Scientific Reports, 11(1), 142. https://doi.org/10.1038/s41598-020-80492-x
Senapati, B., Deb, P., Dash, M. K., & Behera, S. K. (2022). Origin and dynamics of global atmospheric wavenumber-4 in the Southern mid-latitude during austral summer. Climate Dynamics, 59(5–6), 1309–1322. https://doi.org/10.1007/s00382-021-06040-z
Senapati, B., Dash, M. K., & Behera, S. K. (2022). Decadal variability of Southern subtropical SST wavenumber‐4 pattern and its impact. Geophysical Research Letters. https://doi.org/10.1029/2022GL099046