
What is an equatorial wave and why do we care about them?
Atmospheric equatorial waves are confined to, and move, or propagate, along the equator. Equatorial waves can cause variations in pressure, temperature and winds. Each wave type has a different structure. An idealised example structure of a wave type, called the Kelvin wave, is shown in Figure 1. The arrows show the anomaly of wind associated with the wave, in other words how much the overall wind would change as the wave occurs. In this case Kelvin waves can increase zonal winds or decrease zonal winds. And between those two states can increase the convergence of zonal winds or increase the divergence of zonal winds. This wave propagates eastwards so a given region may experience increased eastward winds, then decreased zonal convergence (where winds are directed away from a particular point, red shading in Figure 1), then decreased eastward winds, and so on, as a wave forms and propagates along the equator. These changes to local atmospheric circulations can have an impact on weather in the regions the wave propagates over.

Idealised structure of the Kelvin wave. Arrows show horizontal wind anomaly; coloured contours show where anomalous winds are converging (blue) and diverging (red).
In this post I will focus on equatorial wave influences on rainfall in Southeast (SE) Asia, highlighting some of the work that has been done at the University of Reading in the Equatorial waves and FORSEA projects, funded by the Weather and Climate Science for Service Partnership Programme (WCSSP) for SE Asia. SE Asia experiences extreme weather that is notoriously hard to predict, such as heavy rainfall that causes flooding and landslides. Given its location on and around the equator many parts of SE Asia are very susceptible to modulations of local circulation by equatorial waves.
How are equatorial waves related to heavy rainfall in SE Asia?
In FORSEA and related projects a method has been developed to identify equatorial waves in real world data and forecasts (Yang et al., 2021) which can be used to examine the relationship between equatorial waves and heavy rainfall. In Figure 2 the link between equatorial wave occurrence and heavy rainfall probability is shown. Each panel shows a particular part of a wave occurring over a particular region during a certain season. So, for example, panel a) shows the change in the likelihood of heavy rainfall when there is Kelvin wave convergence over Sumatra in boreal winter (DJF). The yellow shading indicates that heavy rainfall is around three times as likely to occur, orange is four times as likely, and red is five times as likely. The purple lines show the location where winds associated with the Kelvin wave converge. It is clear there is a link between the Kelvin wave wind convergence and an increase of heavy rainfall in Sumatra in DJF, particularly along the coasts.
There are also many other regions where rainfall increases are linked to equatorial wave occurrences. Another wave type is shown in panel d of Figure 2. This is a different wave type called the n=1 Rossby (R1) wave. This wave propagates westward, unlike the Kelvin wave, and is defined by clockwise and anticlockwise circulation either side of the equator. The solid purple lines in this panel indicate this anticlockwise circulation. This can be linked to phenomena such as tropical storms. When anticlockwise circulation (or “positive vorticity”) related to this wave occurs over Peninsular Malaysia there is again an increase in the likelihood of heavy rainfall over the region. The other panels of Figure 2 demonstrate several other cases. For more details readers can find the full study published in QJRMS (Ferrett et al., 2020).
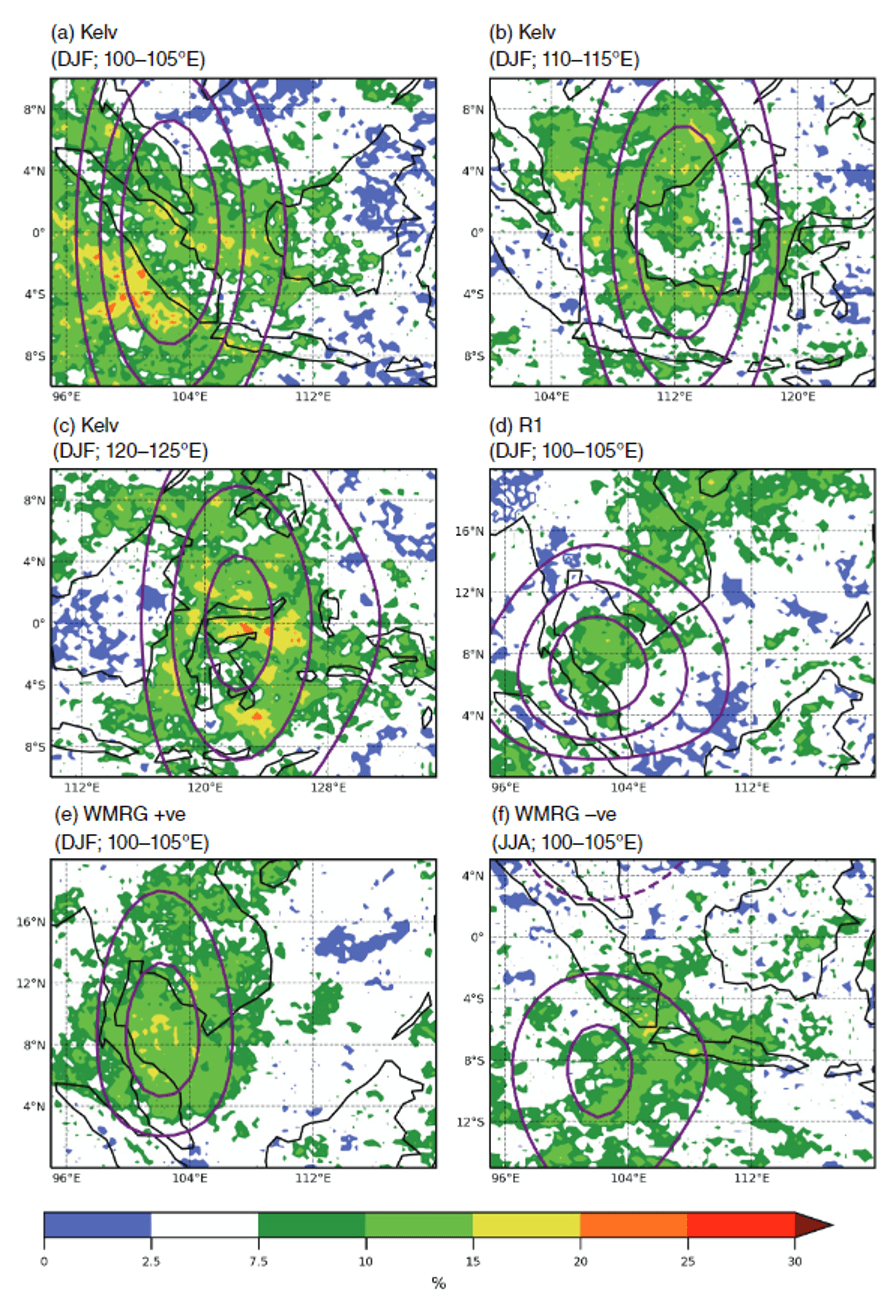
This figure taken from Ferrett et al. (2020). Likelihood of heavy rainfall during days with strong wave activity at low atmospheric level (850hPa). Cases shown are (a) Kelvin wave wind convergence at 100–105°E in DJF, (b) Kelvin wave at 110–115°E in DJF, (c) Kelvin wave at 120–125◦E in DJF, (d) R1 wave at 100–105◦E in DJF, (e) Westward-moving Mixed Rossby Gravity (WMRG) wave convergence in north hemisphere at 100–105°E in DJF, and (f) WMRG wave convergence in south hemisphere at 100–105°E during JJA. A value of 5% and white shading shows no difference from the climatology. Lines show the average convergence (Kelvin and WMRG) or vorticity (R1) on those days with intervals of 5 and 1*10−7s−1 respectively. Solid purple lines indicate convergence/positive vorticity (a measure of anticlockwise circulation), dashed purple lines indicate divergence/negative vorticity.
Why is this useful?
While all this is very interesting, someone may ask, “and what’s the point of this, aside from interest?”. Well, as I mentioned in the introduction our current forecast models can struggle to forecast rainfall in SE Asia. However, the equatorial waves can sometimes be predicted more accurately than the connected rainfall. This means that we can use the forecast of the equatorial waves, and our knowledge of the link between equatorial waves and heavy rainfall likelihood, to create what we have termed a “hybrid dynamical-statistical forecast” of rainfall. In the hybrid forecast we only use the forecast of wave activity, NOT the forecast of the rainfall, to determine how likely heavy rainfall is. This type of forecast has compared favourably to the forecasts of rainfall probability taken directly from the model (Ferrett et al., 2023; Wolf et al., 2023). Furthermore, combining the influence of multiple waves into one hybrid forecast further improves the hybrid forecast skill.
There is still a lot to learn about how waves and other modes of variability on differing time scales can interact with one another, and what this means for heavy rainfall and other extreme weather events. Ongoing work in our new project FORWARDS is aiming to tackle these questions.
References
Ferrett, S., Methven, J., Woolnough, S. J., Yang, G. Y., Holloway, C. E., & Wolf, G. (2023). Hybrid Dynamical–Statistical Forecasts of the Risk of Rainfall in Southeast Asia Dependent on Equatorial Waves. Monthly Weather Review, 151(8), 2139–2152. https://doi.org/10.1175/MWR-D-22-0300.1
Ferrett, S., Yang, G., Woolnough, S. J., Methven, J., Hodges, K., & Holloway, C. E. (2020). Linking extreme precipitation in Southeast Asia to equatorial waves. Quarterly Journal of the Royal Meteorological Society, 146(727), 665–684. https://doi.org/10.1002/qj.3699
Wolf, G., Ferrett, S., Methven, J., Frame, T. H. A., Holloway, C. E., Martinez-Alvarado, O., & Woolnough, S. J. (2023). Comparison of probabilistic forecasts of extreme precipitation for a global and convection-permitting ensemble and hybrid statistical–dynamical method based on equatorial wave information. Quarterly Journal of the Royal Meteorological Society. https://doi.org/10.1002/QJ.4627
Yang, G. Y., Ferrett, S., Woolnough, S., Methven, J., & Holloway, C. (2021). Real-Time Identification of Equatorial Waves and Evaluation of Waves in Global Forecasts. Weather and Forecasting, 36(1), 171–193. https://doi.org/10.1175/WAF-D-20-0144.1