By: Buwen Dong
Heat waves (HWs), commonly defined as prolonged periods of excessive hot weather, are a distinctive type of high-temperature extreme (Perkins 2015). These high-temperature extremes can lead to severe damage to human society and ecosystems. In our studies, we focus on decadal changes in the HWs over China and consider three independent types:
Compound HW—at least three consecutive days with simultaneous hot days and hot nights (Tmax ≥ 90th percentile and Tmin ≥ 90th percentile).
Daytime HW—at least three consecutive hot days (only Tmax ≥ 90th percentile), without consecutive hot nights.
Nighttime HW—at least three consecutive hot nights (only Tmin ≥ 90th percentile), without consecutive hot days.
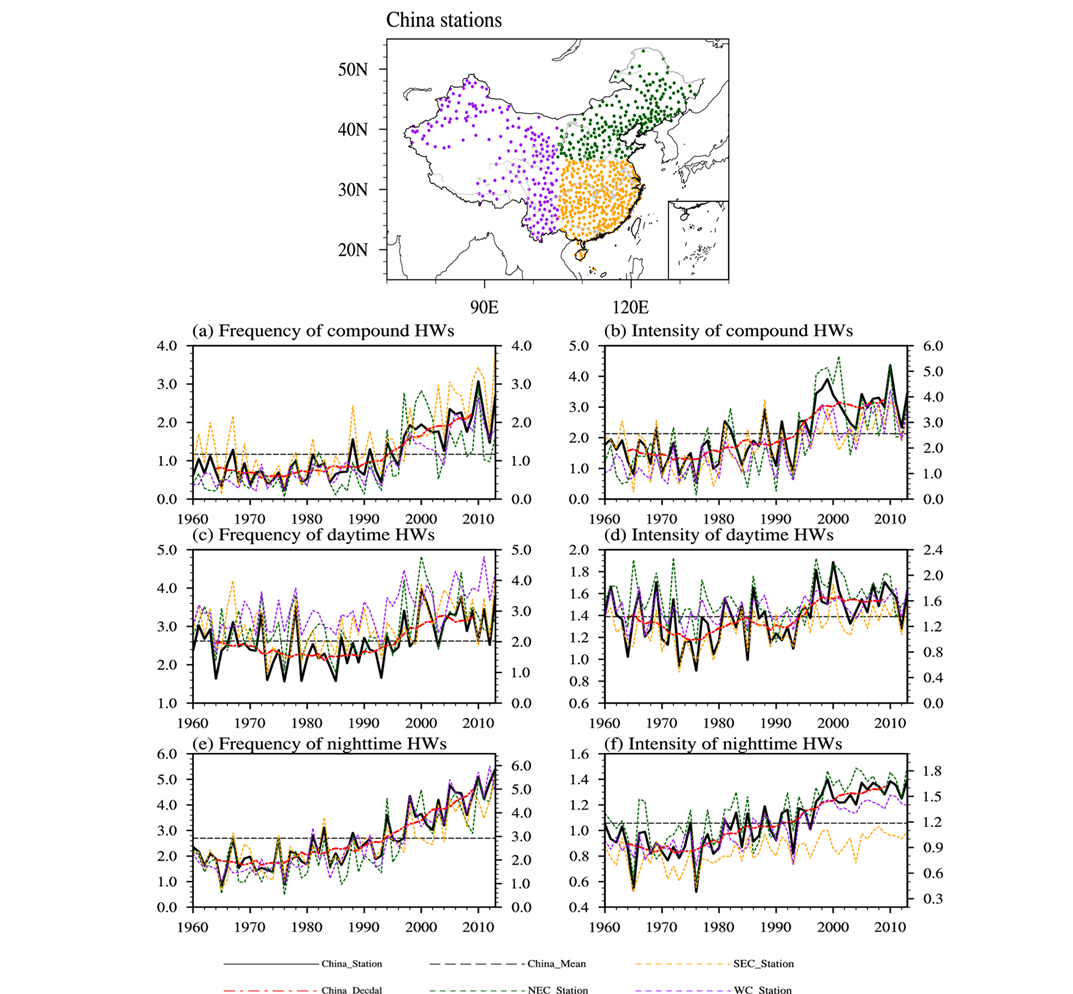
Illustrated in Figure 1 are distributions of 753 stations in China station dataset and the time evolutions of the area-averaged frequency and intensity of the compound, daytime, and nighttime HWs over different regions in China. One of most important features is the abrupt decadal change across the mid-1990s, from the early period (EP) of 1964-1981 to present day (PD) of 1994-2011, characterized by increases in frequency and intensity (Su and Dong 2019a).

Figure 1: (Top) Distributions of 753 stations in China station dataset. The dots in green, orange and purple represent the sub-regions of North-eastern China (NEC), South-eastern China (SEC) and Western China (WC), respectively. Time series of area-averaged (left) frequency (events per year) and (right) intensity (°C) of (a)–(b) compound, (c)–(d) daytime, and (e)–(f) nighttime HWs in extended summer over the whole mainland of China (black solid lines), North-eastern China (blue dashed lines), South-eastern China (orange dashed lines), and Western China (green dashed lines). Black dashed lines denote the time means of area-averaged indicators. Red solid lines represent the decadal variations of area-averaged indicators, obtained by a 9-yr running average. The black solid and dashed, as well as the red solid lines are for the left Y axis, while the dashed blue, orange, and green lines are for the right Y axis.
What has caused these rapid decadal changes in HW properties across the mid-1990s over China? A set of numerical experiments using an atmosphere–ocean–mixed layer coupled model (MetUM-GOML1; Hirons et al. 2015) have been performed in a study by Su and Dong (2019a) to understand the relative importance of changes in greenhouse gas (GHG) concentrations and anthropogenic aerosol (AA) precursor emissions.
The area-averaged changes in frequency and intensity of the three types of HWs over all of China and all three sub-regions for both observations and model experiments are demonstrated in Figure.2. Quantitatively, the changes of the three types of HWs in response to ALL forcing changes simulated by models are in some agreement with observations, not only over China as a whole, but also over the individual sub-regions.

Figure 2: Area-averaged changes in (left) frequency (events per year), (centre) intensity (°C), and (right) spatial extent (km2) of (a)–(c) compound, (d)–(f) daytime, and (g)–(i) nighttime HWs over all of China, NEC, SEC, and WC in observations and simulations forced by ALL forcing, GHG forcing, and AA forcing. The error bars indicate the 90% confidence intervals based on a two-tailed Student’s t test.
The results above indicate that the observed decadal changes in the frequency and intensity of compound, daytime, and nighttime HWs over China across the mid-1990s are primarily forced by the changes in anthropogenic forcings. The impacts of GHG changes and that of AA changes are different in many aspects. GHG changes contribute dominantly to the increases in all aspects of the three types of HWs over most regions in China, while AA changes significantly increase the frequency and intensity of the daytime HWs over NEC but decrease them over SEC.
Looking forward in the next few decades, greenhouse gas concentrations will continue to rise and anthropogenic aerosol precursor emissions over China will decline. Projected future changes of the three types of HWs over China in the mid-21st century relative to the present day are stronger than their decadal changes across the mid-1990s (Su and Dong 2019b). Notably, projected future changes relative to PD in the frequency of compound HWs and all three aspects of daytime HWs are 2–4 times of the corresponding decadal changes across the mid-1990s in observations. The future increases in the duration of compound HWs and the frequency and duration of nighttime HWs are 20–80% larger than their decadal changes across the mid-1990s. These results suggest people will encounter much fiercer changes of HWs over China in the future than they have experienced across the mid-1990s and China would face a challenge to take adaptation measures to cope with the projected frequency increase, intensity enhancement and duration extension of HWs.
