
By: Kieran Hunt
Cast your mind back to 1900. The World’s Fair. Great Britain has just won 48 medals at the Summer Olympics including a clean sweep in the steeplechase. Queen Victoria’s reign continues through an unprecedented 63rd year. British heroes, the Queen Mother and Douglas Jardine, are being born. At 43 Market Street, Manchester (now the home of a massive Urban Outfitters, apparently), an aging Italian immigrant, Joseph Casartelli, owns a workshop specialising in the construction of measuring instruments. Now, forward 120 years (I’ll spare you the scene-setting this time), and I was delighted to receive one such instrument, a barograph, as a Christmas gift from my convivial father-in-law.
Barographs of this era comprise two basic components. On one hand, there is an aneroid barometer – typically a stack of partially-evacuated alloy cells that expand and contract as the pressure decreases or increases. On the other, a clockwork drum is set to rotate about once per week. The two are connected by a scribing arm holding an ink nib. When operating, the nib rests against a paper chart wrapped around the drum, marking pressure changes with time. (Figures 1-3)

Figure 1: Close-up photos of the Casartelli & Son barograph. Top left: inside the clockwork drum. Top right: The spindle on which the drum sits. Bottom: the drum in place, with the scribing arm and ink bottle visible. The aneroid cells are conveniently sealed inside the oak casing and thus not shown here.

Figure 2: The barograph operational setup, showing the drum with paper affixed, scribing arm, and connection to the aneroid in the base.
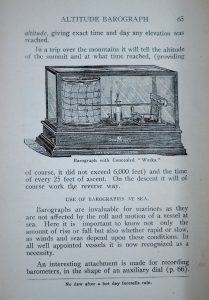
Figure 3: A page from Percy Jameson’s “Weather and Weather Instruments”, published by Taylor in 1908, showing an engraving of a similar barograph. He’s also not happy about the “concealed works”.
The Storm
As luck would have it, the arrival of Storm Bella (Figure 4) on Christmas night meant that I could test the barograph immediately. With a coffee to steady the post-Christmas hangover (note: it did not steady my hands), I carefully filled the nib with ink, attached the paper to the drum, and woke the clockwork from its multi-decade slumber. It wasn’t that easy of course, it actually took me two hours to figure out that the clockwork wasn’t working, but increasingly firm shaking (the instructions called for “rotation about the horizontal plane”, make of that what you will) soon set it in motion.

Figure 4: Photo of Storm Bella irritating British residents, in this case the owner of a Rolls Royce. Credit: PavementsForThePeople via BBC.
The Results
Figure 5 shows the barograph trace from just after the initial fall in pressure associated with Storm Bella through its development, and eventual recovery by New Year’s Day. Now, a confession in two parts: Boxing Day was a Saturday and the log papers start on Mondays – not wanting to reset the equipment two days into the experiment, I took the liberty of adjusting the calendar. I also confused 12pm with 12am during the initial setup. Bearing these in mind, I overlaid pressure data from the atmospheric observatory at the University (shown in red in Figure 5).
So, how did it do? Well, there are two major differences compared with the observatory record – the first is an initial offset of about 5 hPa, the second is an overestimate of the minimum pressure: 979 hPa on the barograph compared with 963 hPa at the observatory (a difference of 11 hPa when accounting for the initial offset). I had hoped the initial offset was due to elevation differences, but the observatory is only 20 m higher than my house, accounting for just 2 hPa. The rest was almost certainly due to clumsy alignment, a regrettable by-product of my unsteady hands and a remarkably sensitive scribing arm lever. I suspect a similar alignment problem caused the overestimated pressure minimum – in setting the scribing arm position, too much force between the nib and drum results in friction that prevents the scribing arm from moving freely. If we adjust the observatory data to account for these issues (Figure 6), by shifting it up and squashing it a bit, the barograph does a clearly exceptional job of capturing the hour-to-hour pressure changes, keeping within 1 hPa of the observatory values for the whole week.

Figure 5: The barograph trace from Storm Bella (dark blue). Overlaid is the pressure reading from the automatic sensor at the University Observatory (red). If you look carefully at the beginning of the trace, you’ll see my various attempts to get the clockwork moving.

Figure 6: As Figure 5, but with the observatory data shifted and compressed to take into account various barograph calibration errors.
Conclusion
Calibration issues could probably be overcome with a bit of practice, but I probably wouldn’t recommend using it to land a plane. In the right hands, though, it probably could still be used operationally. Amazing.
References: