By: Mathew Owens
The Sun’s magnetic field varies on all observed time scales. Knowing how the solar magnetic field has changed in the past helps us plan for hazardous conditions in the space environment in the future. It is also important for modelling the Earth’s climate system. In order to reconstruct past solar variability, we must call on a diverse range of data sources.
Over minutes to days, changes in the solar field can be directly observed by space-based telescopes and in situ monitoring spacecraft. Variability on these short time scales is referred to as “space weather” as it can adversely affect space- and ground-based technologies, as well as posing a health hazard to astronauts and passengers/crew on high-altitude flights [1]. To help mitigate the worst effects, the UK Met Office routinely issues a space-weather forecast for the next few days.
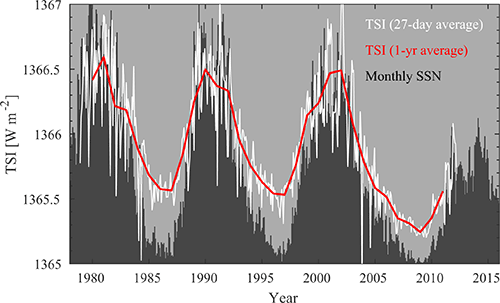
A near-continuous record of spacecraft observations back to the mid 1960s shows that the solar magnetic field also has strong periodic behaviour in the form of the approximately 11-year solar cycle. As shown in Figure 1, total solar irradiance (TSI) — the Sun’s energy input to the Earth’s climate system — varies closely with the Sun’s magnetic field and hence the solar cycle. The amplitude of the solar-cycle variation in TSI, however, is only around 0.1%, meaning it has a very small contribution to terrestrial global temperature variations, even on decadal time scales.

Figure 1: Total solar irradiance variations from the PMOD composite (Dudok de Wit, Kopp, Fröhlich, & Schöll, 2017). White and red lines show 27-day and 1-year average values, respectively. The solar cycle is indicated by the black-shaded area, which shows sunspot number, arbitrarily scaled. Figure taken from [2]
Space weather is also strongly linked with the solar cycle, at least in a probabilistic sense. This is best seen in geomagnetic records, which measure the disturbance of the Earth’s own magnetic field down at ground level, which in turn can be directly related to the strength of the solar magnetic field driving the disturbance. Geomagnetic records from sufficiently sensitive compass observations extend back around 160 years. Figure 2 shows that severe space-weather events roughly follow the 11-year solar cycle.

Figure 2:. Annual occurrence of space-weather storms of different magnitudes, with red, blue, and white indicating moderate (top 5% of all days in the study), severe (top 1%), and extreme (top 0.1%), respectively. The black shaded background shows sunspot number, arbitrarily scaled. Note the logarithmic scale and that zero occurrence has been set to 0.1 for plotting purposes. Figure taken from [2].
The solar cycle was first discovered in the number of visible sunspots on the solar surface. This property can be reconstructed back over 400 years using records extending all the way back to Galileo’s first telescopic experiments in 1610. Large variations in the magnitude of solar cycles suggest that “space climate” can also vary significantly. Reconstructing the solar magnetic field (and hence TSI) on time scales longer than a few centuries requires the use of even more indirect proxies.
One such proxy is galactic cosmic rays (GCRs), near relativistic charged particles which originate outside of the solar system, at astrophysical objects such as supernovae. As charged particles are deflected by magnetic fields, the Sun’s magnetic field partially shields Earth from GCRs. When GCRs do enter the Earth’s atmosphere, they collide with air molecules and create a shower of exotic decay products. These include isotopes which do not naturally occur, such as Carbon-14 and Beryllium-10. Such “cosmogenic” isotopes are removed from the atmosphere and deposited in biomass and ice sheets, respectively, providing natural records of GCR intensity, and hence the Sun’s magnetic field, over the last 9,400 years or so.

Figure 3: A summary of the long-term variations in the Sun’s magnetic field (HMF). Top: Millennial-scale reconstructions of total HMF from cosmogenic radionuclide data (Wu et al., 2018), scaled to match values in the bottom panel. Bottom: Sunspot (red), geomagnetic (blue), and spacecraft (pink) estimates of total HMF. Figure taken from [2].
Figure 3 shows a comparison of the different methods of reconstructing the Sun’s magnetic field. While the data sources differ wildly (state-of-the-art spacecraft, Victorian-era compasses, 17th-century telescope observations, tree trunks and ice sheets), the agreement is remarkably good. The Maunder minimum, from 1650-1715, is the period of weakest solar magnetic field in the 9,400 year reconstruction, while the 1960s were the strongest. Thus the sunspot record spans the full range of recent solar magnetic variability, making it invaluable for understanding space weather and solar forcing of terrestrial climate.
(There’s also a movie of Figure 3 available here: https://twitter.com/mathewjowens/status/1392074668199354372)
References:
