
By: Carlo Cafaro
Probabilistic weather forecasts contain useful information that could save lives by issuing early and accurate warnings. This is especially true in Africa, where the livelihoods of people rely significantly on agricultural activities. These, in turn, depend on weather conditions – particularly rainfall. Every year, droughts and floods pose a serious threat by altering the levels of food security.
In the last months of 2019, for instance, unusually heavy rains battered East Africa, causing landslides and flooding with over 2.8 million people affected, according to the UN and at least 137 people dead in Kenya and Uganda.
Most of the annual rainfall of tropical East Africa comes from deep convective systems. This is true also for West Africa, where 90% of the annual rainfall in the Sahelian is produced by a small number (12% of the total) of organized mesoscale convective systems (see [2] for details).
For example, convective storms usually hit Lake Victoria overnight. The lake is crucial for the local fisheries and for providing a means of transport between the local communities. However, according to the World Bank, every year up to 5000 thousand fishermen die by drowning in the lake. Sudden strong winds caused by nocturnal thunderstorms can capsize their boats, which often are overloaded or are not properly safe to use.

Figure 1: The UK and African partners of the SWIFT project. Courtesy: P. Hill
This is why there is urgent need of accurate and useful weather forecasts, from hourly to seasonal timescales. This is the overarching aim of the GCRF African SWIFT project, which I am working on. It kicked off in November 2017 and brings together UK and African scientists, operational forecasters and users to improve the weather forecasting capability of the African partners (see Figure 1 for a summary of the different partners of the project).
Numerical weather prediction (NWP) global deterministic models have too coarse a grid spacing to realistically represent convection. Hence they use parametrization techniques, which are found to be not so skillful.
This is because they tend to produce too much light rain and miss the most intense events. Another well known problem is that they cannot reproduce well the diurnal cycle of precipitation, with the peak of rainfall too early with respect to observations.
There are thus two options (not mutually exclusive) to try to improve the skill of rainfall predictions: run an ensemble of forecasts, hence producing probabilistic weather forecasts and/or decrease the size of the grid spacing down to kilometer-scale, thus allowing the convection to be explicitly represented and not parametrized (the so-called convection-permitting models, CP).
When considering an ensemble of coarse grid-box global models, the results are not so encouraging [4].
The Met Office has thus been running, since 2011, a finer deterministic grid size model over East Africa (4.4 km grid spacing). Although CP models have been shown to be more skillful than the respective coarser grid models (e.g. [1, 5]) for the Lake Victoria region, the skill is still fairly poor and so there is still room for improvement.
Hence the motivation to combine the two options previously discussed, to generate convection-permitting ensemble prediction systems (CP-EPSs). These are usually run on limited areas, with boundary and initial conditions provided by the global ensembles.
These models are fairly novel (~10 years) and have been run only in extra-tropical regions by several forecasting and research centres.
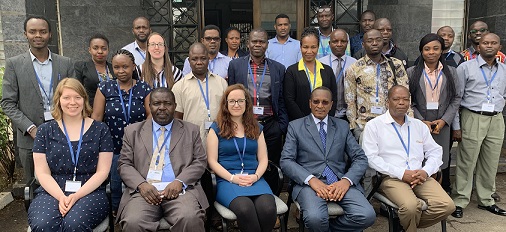
Figure 2: SWIFT news
In April 2019, the Met Office, as part of the SWIFT project, ran CP-EPSs for the tropical Africa domain for the first time. These were tested in real time during the forecast testbed hosted by the Kenya Meteorological Department (KMD) in Nairobi between 23rd April and 6 May 2019 (in Figure 2 a group picture of some of the participants).
Scientists and operational forecasters gathered in the same room, working in shifts for 24 hours. We were using nowcasting and CP ensembles forecasts to predict convective storms over West and East Africa up to 72 hours ahead. One of the morning tasks was the ‘subjective’ evaluation of these forecasts.
Participating in this real-time experiment allowed me to see the task of verifying CP-EPSs, part of my PhD work as well, from a completely different perspective.
This is because speaking directly with the local forecasters and the users in Kenya helped me shape my activities, making me think in a more user-friendly way.
First of all, it is important to be able to extract the information from the “big data” produced by the CP-EPSs. Then to communicate and verify them.
For example, over Lake Victoria, one piece of forecast information could be the probability of rainfall exceeding a threshold over a certain accumulation period. The shorter this period is, the more useful the information. Another option could be to detect the location and timing of the peak of rainfall.

Figure 3: Convective-scale probabilistic forecast map of rainfall exceeding 10 mm accumulated on 03/05/2019 between 00 and 06 UTC. Courtesy of Stuart Webster.
An appealing graphic, which can be understood by a local forecaster could then be used to communicate this information.
Figure 3 shows the map produced during the testbed of the probabilistic forecast of rainfall accumulation exceeding 10 mm over 6 hours.
Also, a map displaying the location of initiation of a thunderstorm, along with the trajectory paths of its propagation, is another possibility.
The last step, forecast verification, consists of two aspects, as stated by WMO: assessing the technical skill of a forecast (for example by producing the reliability diagram as explained in this blog post by Jochen Broecker) and to ascertain whether the forecasts issued help the user to take decisions. This was stated in other terms also by [3] in terms of quality and value of the forecasts.
Even computing the forecast skill can be done in a user-oriented way: WMO issued a challenge to find the best way to do that [2].
In light of this, an important activity carried by the KMD was the collection of feedback of forecasts users.
This feedback will certainly help all of us involved in this project to reach our goals: make a positive impact into the lives of the African people by providing skillful weather forecasts.